A key for the above chart to define the horizontal lines and dots. For further explanation, see this link:
Breadth - Started out neutral/bearish. Afternoon breakout coinciding with IB_high break.
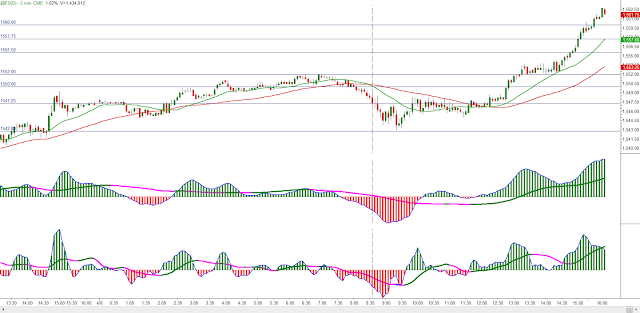
ES globex - Dash vertical is the market Open. Top indicator replicates a 15m 3/10macd while the bottom one is a 5min (Two time frames in one).
Volume Profile - The day started out as 'Non-Trend' day (Small IB_range & D-shaped profile) but turned into 'Normal Variation' day (IB_High broken as OTF became active). <- Might have been a Double-Distribution trend day?
Trades - Early, frustrating chop paid off later on
Quite the move we've had here
Important week in determining follow-through or rejection. For now, the trend is still very much intact


No comments:
Post a Comment