The setups I include on this blog are used in conjunction with the 3/10macd and the criteria I ascribe to it as a way to alert me to an existing condition of price. The key concept to take away from this blog is that I try to anticipate what will happen on the higher time frame by using a faster time frame to trigger the trade setup. I do not trade a "system" I use two indicators to clue me in to price conditions. Please read the Disclaimer located in the sidebar of this site. I can be contacted via email at toddstrade@gmail.com
I am always open to questions, comments, or suggestions on how to improve this blog.


Thursday, October 27, 2011

Recent 3d setups

A couple of 3d setups on the daily time frame which played out.

EURUSD - could probably measure the Fib.s differently, but today's move is beyond what most were likely expecting (a squeeze upon a squeeze).

GLD - Again, the Fib projections are so-so

XLF 

Copper -

Wednesday, October 26, 2011

2 short 2 long

4 trades in the SPY today.
-First short entry on 4c bearish continuation. 
-The second exit from the first trade and a long entry taken was at the Previous Month Open price (coincided with the midpoint of the gap from 10/21 (position was small but good for $1/share).
-Short entry as price exited from the flag pattern.  Covered as price recovered the PDL on tweezer lows.
-Long entry based on the 3d setup which happened very quickly and so I took the entire position off at the 50% projection.

Tuesday, October 25, 2011

4 shakeouts

4 trades, all for roughly break-even. Posting this for posterity's sake. The setups were a 4c continuation short (a small profit), a triangle breakdown (shaken-out b/e), a 3d long entry (covered commissions) followed by a short entry once the 3d criteria rolled-over (closed the trade for a small profit b/c I was frustrated & exhausted).

INX

Striking similarities between the S&P500 now compared to March-May '08.  Nearly identical 3/10 macd pattern with a short-squeeze rally in a bearish market (if one were to consider price under a 20- & 50-MA).  All coinciding with the 1256 level; Support turned Resistance.

Friday, October 21, 2011

strong sentiment

Very active pre-market
SPY

ES_F


A good setup for the strong sentiment day is to fade the extreme TICK
Notice either a new low TICK or a New low TICK combined with a price divergence.  The first example illustrates where price made a lower low on a higher TICK (at vwap).  Finally, look to play the little cup/handle pattern breakout

Thursday, October 20, 2011

Down morning Up afternoon

Long QID early in the morning.  Two entries.  The first I took a small loss on as the market was still coiling in the triangle pattern, the second entry had the follow-through that I was initially looking for.  Partials taken at the 50% & 100% projections.  I did keep 15% of the initial position on as a runner but took it off when price came back to the 50% projection (not indicated).


  Covered the remainder of my SPY short position from Wed. afternoon before going long later today. Partial exits taken at the 100% & 200% projections.


Wednesday, October 19, 2011

recent examples

The 3d "bottoms" (seed wave) and the 2b tops (which can mimic an "Avalanche" -type setup or often 3-pushes to a top setup):
In the ES


and in Crude


2c

The 2b or 2d-2c criteria are indicative of good topping patterns to look out for.  Just as the 3d will draw my attention to a potential bottom, this criteria hints at an impending top (defining tops/bottoms are dependent upon your time frame).  First thing I would like to see is price closing, or attempting to close under the 20MA on the 15min chart.  Today price rode the 20MA for over two hours before breaking down from its pennant pattern.
Three exits with a final portion (15%) held overnight (stop above $123).

Tuesday, October 18, 2011

SPY 3d

Mentioned yesterday about this setting up. Worked nicely, complete with a perfect seed wave and inverse H&S.  Patience was needed in achieving the 200% projection target, of which I have none.

Monday, October 17, 2011

meh

A couple of setups.
AAPL 4d-to-4c bearish continuation.  Price came back quickly and hit my trailing stop at +$0.95/share.

SPY 4d-to-4c bearish continuation.  Entry was earlier than the technical trigger while the exit was based on the 5m that looked to be setting up a 3d criteria, +$0.68/share.
Also took the 3d long entry at the end of the day AND turned to go short.  The long entry resulted in a $0.10 loss and the short I took got stopped out of with a $0.21/share loss.  
I'm thinking the $120.20 area could be support tomorrow (or resistance if we open below).  Looking to see if the 3d pattern that set up into the close will either follow-through or roll-over.

Wednesday, October 12, 2011

50%

3/10macd is registering its highest bullish reading since March of 2009 exceeding the previous reading from August 31st (still a reverse divergence, it will be a reverse divergence until it surpasses the Aug 31 swing high).  

Currently look to be in the 3rd push on waning momentum

Monday, October 10, 2011

SPY weekly

First day of the week, so no telling how this weekly chart's candle will close, but a couple of patterns stand out.
On the weekly; 3-pushes to a low followed by a gap above the down trend line and 3d criteria on the 3/10macd indicator.
On the daily;  A momentum buy divergence at the bear trap.  The first test of the 50-day MA since 08/01 and we gaped at it and closed strongly above it.  $120 looks like obvious resistance, a test of which would give a reverse (sell) divergence (higher high in momentum, lower or equal high in price).   All of which would set up a very buy-able dip.
Closer look at the weekly.  A rally back to $127 would set up a reasonable short opportunity :

Saturday, October 8, 2011

par

Percentage gains of the SPY short covering rallies so far....about par for the course.

These cycles have been perfect, all ranging from about 6-10 bars/days. A picture perfect example of Stevenson Price and Time Target theory:

FAZ

I almost bought this as price was testing the 50% Fib. early in the morning.  I flipped through some more charts, came back to it, and I missed the initial move.
A 3d setup occurred into the close of the previous day and failed to follow-through (which often allows for a a good reversal trade).  Coming into the next day, consolidation at the previous day's low allowed for another 3d setup to form (I still consider this a 3d regardless of the fact that the 3/10macd technically showed 4d criteria.  It is close enough and an indicator, and the criteria I ascribe to it, is just there to alert me to a condition in the market).   After hitting its first target (previous day's breakdown point coinciding with the 50% projection) price formed a cup & handle pattern before breaking higher and taking out its next breakdown point (150% projection).

The 5-min chart has three up arrows in close proximity indicating probable entries.  The average stop level for an issue such as FAZ is somewhere around $0.60-$0.90.  So if you kept a stop below the most recent swing (about 90-cents away) you would have remained in the trade.  If you kept a tighter stop in the 60-70-cent range you would have gotten stopped out twice before catching the breakout, which would have covered your losses and then some. 

UCO

Unfortunately this is a "hard to borrow" issue on the short side, but it's the only thing I've found that closely reflects the movement of Crude Oil.  When a trend is strong (for my purposes the 15-minute chart with 20- & 50-MA's indicate trend direction and strength), and the trend in Crude has been bullish all week, you'll see these momentum sell-offs into support that are good buying opportunities. The momentum indicator sets up a reverse divergence ("Sling Buy") where there is a lower low in momentum and a higher low in price. The 5-minute chart demonstrates three pushes to a low forming an inverted Head & Shoulders. First target was the 100% projection which coincided with the price breakdown point. Position closed on price failing to hold the Open on waning momentum near the end of day.

Wednesday, October 5, 2011

wednesday

A 3d long entry I missed today in the GLD


Long entry in CVX.  Exited the majority of the position at the close of the bar at the down arrow, held a small position as a swing trade based on the higher time frame.

I went long FAZ based on the 3d criteria, but taken in perspective with the broad market after getting stopped-out (lost $0.60/share) I went short (there were actually shares to borrow!).  I mentioned the other day that when a 3d long setup fails, it is usually profitable to reverse the trade.  Exited the majority of the position at the 200% projection ($4/share) and held a small position overnight. 


Tuesday, October 4, 2011

missed it

Screwed up this 3d long entry on the SPY today.
The setup was more apparent on the 30-min time frame

I went long too early and didn't get back in when I should have :/
Should have gotten back in as indicated below, though it was difficult to chase a long in such a bearish market, especially without much of a pullback.  You never know when a move like this is going to happen.  The biggest disappointment was that I was actually anticipating a 3d setup for half the afternoon, then only to screw it up in the end is incredibly frustrating.

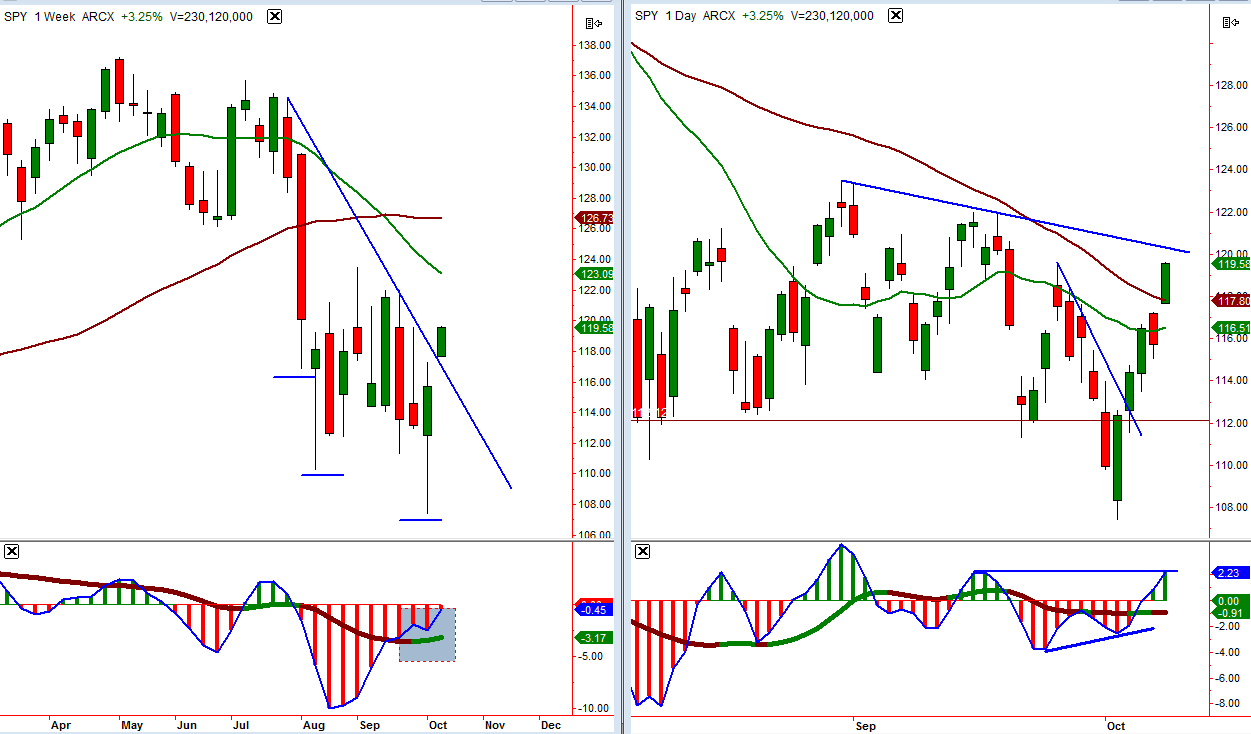
Anyway, the SPY daily left us with what appears to be a bear trap on a bullish divergence.  7% higher and I wouldn't be surprised to see new highs by the end of December :/

Oh yeah, and the SPY weekly is possibly setting up this 3d criteria as well (looking for green fast line and/or a seed wave on the Daily as trigger to entry).

The ES ALMOST made a tweezer low today.  This could rally over 80-points and STILL be bearish.

The NQ still hasn't broken its low, has a similar 3d setup on the weekly (looks better actually) and can rally 130-points and STILL be bearish!

Monday, October 3, 2011

SPY 4c-to-4d continuation setup.

AAPL long 3d criteria.  I thought this was a b/e trade, but I actually lost about $0.25 on this.  When a 3d setup fails often makes for a good short entry.  Reversing this entry from long to short would have worked initially, but could have just as easily resulted in a stop-out considering the whippy move around 3:00.
The inverse names have been setting up for a while now.  This would have been better off adding too rather than jumping in and out of as I did.  First entry was a target of 1/2 position for $1, 2nd half b/e.  Second entry was a stop-out at b/e and the third entry was for the move into the close for $1.


Saturday, October 1, 2011

month end

I posted this monthly chart a while ago highlighting the fact that the 3/10macd had triggered a 2c short bias, which often preceded the beginning of a bearish cycle:

The looks to be potential at this point for a bullish momentum divergence which could cause a rally and quite possibly creating a Head & Shoulders pattern on this monthly chart (next summer?).  Purely speculating of course.  The downside support (should we trade under current lows) should be quite solid though and a rally off of that area wouldn't come as a surprise. 

bulls denied

Oh well, the bulls just couldn't pull it off. Price looked like it might break out of this down trend line, but each test was sold.
 Price closed right on the 78.6% retrace, so the only thing saving this market now seems to be a double-bottom.
The daily charts 3/10macd has been showing 4d criteria (pullback following bearish momentum).  So the anticipation would be for bearish continuation (4c) or a squeeze to test higher resistance (3a).  In order to anticipate this daily chart setup we use a some faster timeframe, I like to use a 130-minute chart because there are three 130-minute bars that make up a day.
So, if you're looking to swing trade this setup (4d-to-4c continuation) the entry came on Thursday like so;

At this point it's important to watch for a bullish divergence as price tests support.  The faster time frames will give clues.