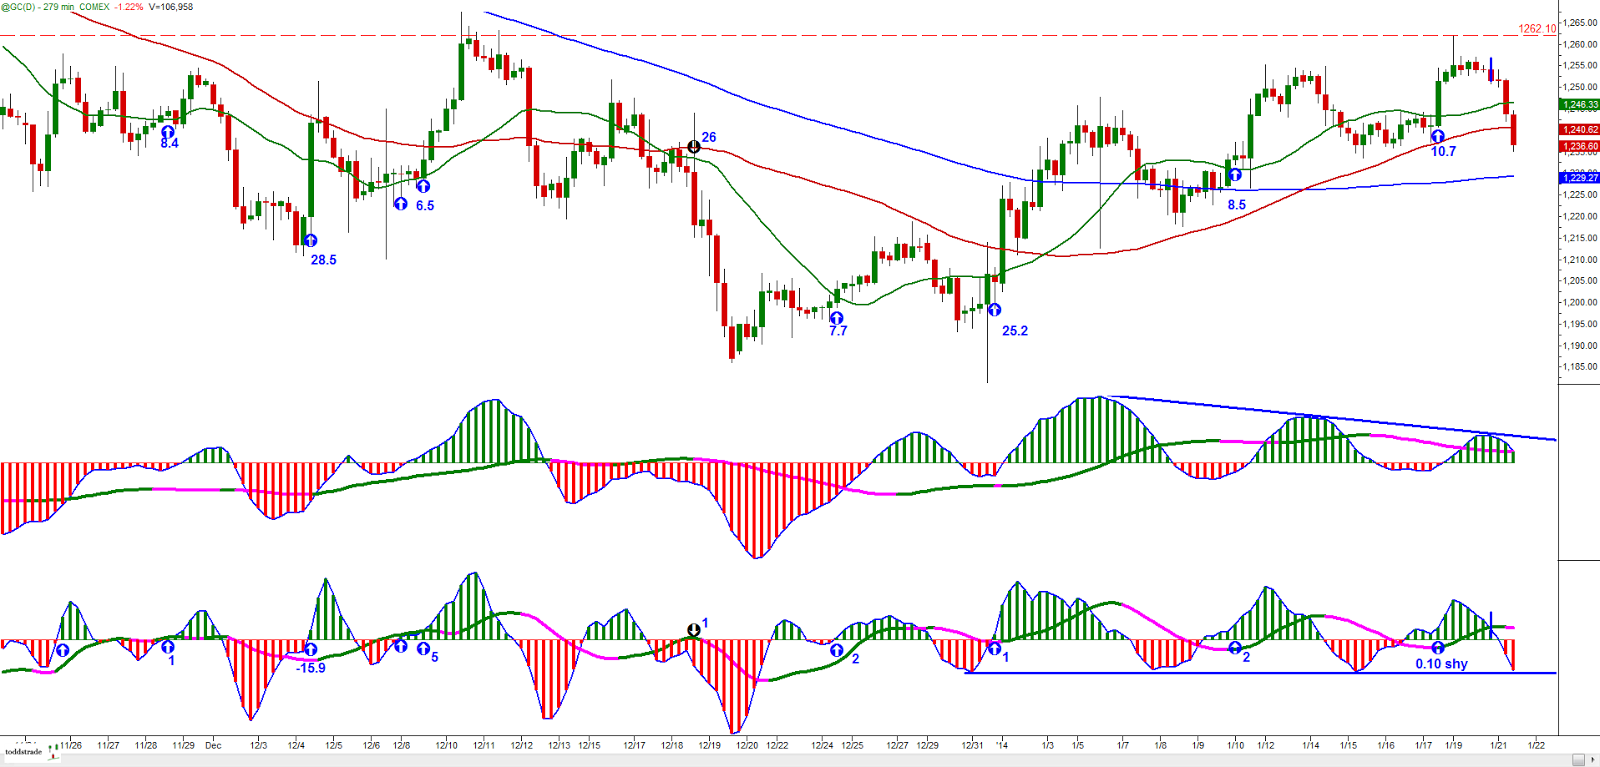
Updated chart from the ones below, to show the fast line/slow line cross providing a warning if long
Actually a bit surprised that Gold continues to squirm higher.
The daily is putting in fairly symmetrical cycles and is at a point where one side will show their hand and we'll see if bulls or bears are stronger here. The bulls have a double-bottom on their side, while the bears have everything else (moving averages, trend lines, and overall trend).
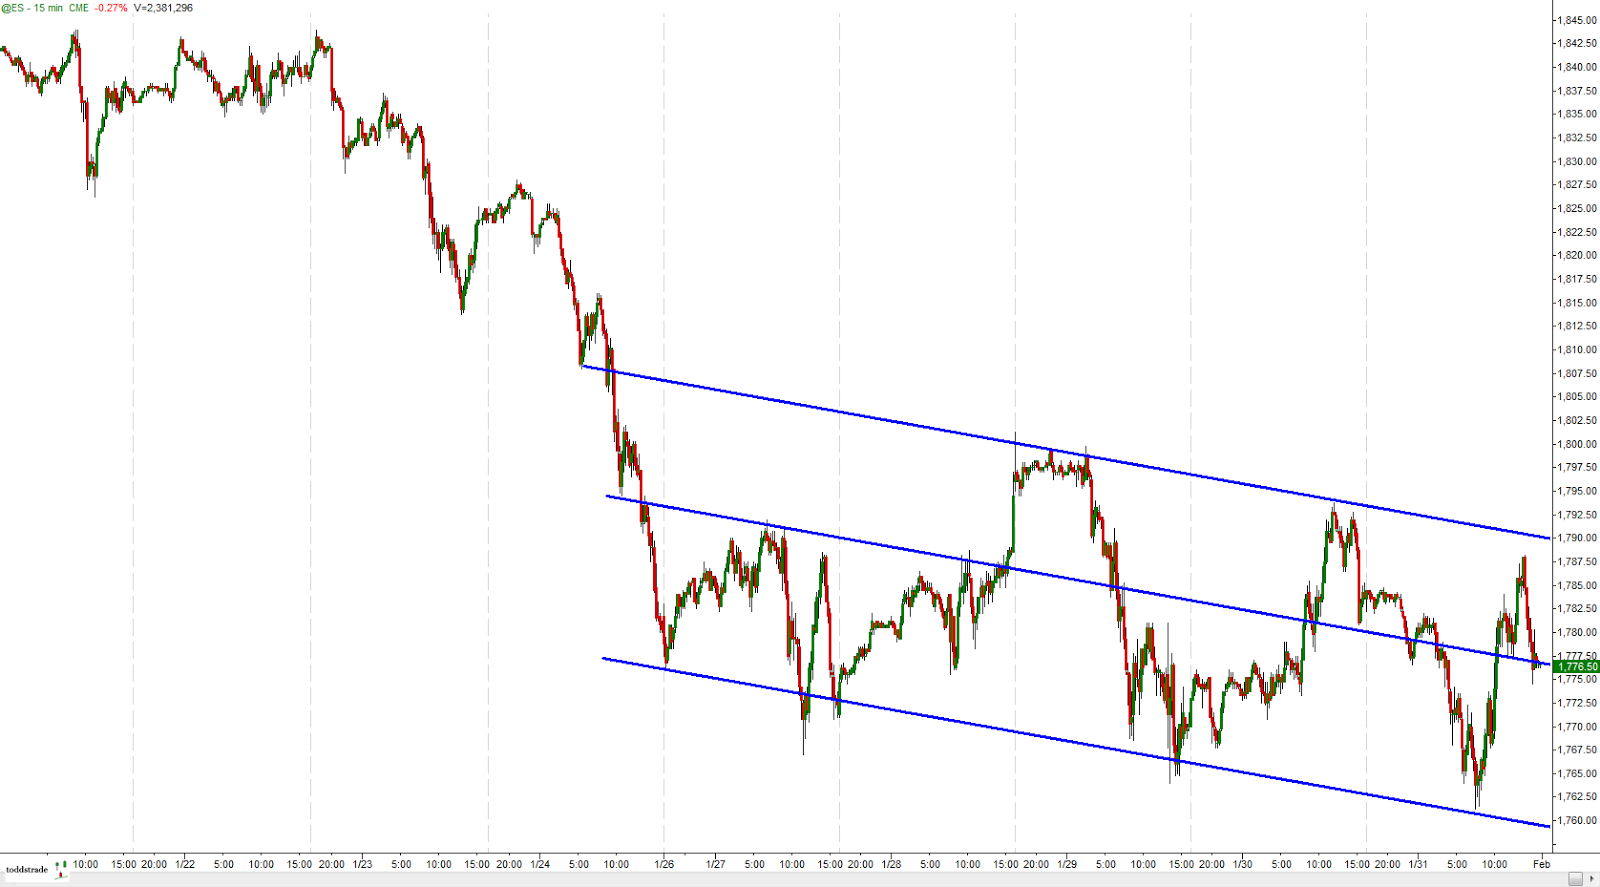
The 4-hour came so close to it's initial target. It still has an opportunity to achieve it, but it can be sketchy holding a position on a fairly late entry so close to resistance (a for sure exit would be the fast line/slow line cross on this time frame's 3/10macd (lower subset indicator).
a better look at the cycles