

Tuesday, December 20, 2011
Corn
While I'm away, with limited broadband speed, my posts will be limited as well.
Here's a 3d setup in the daily chart of Corn.

Here's a 3d setup in the daily chart of Corn.

Wednesday, December 14, 2011

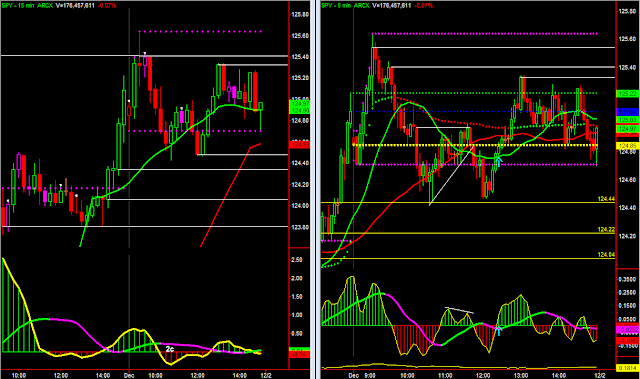
A/D zero-line
An example from yesterday in the SPY of the Adv/Decl zero-line acting as temporary support. Mentioned before in this post. Coincided with a support level and TICK divergence


Monday, December 12, 2011


selling
Selling in the ES since the early morning. Here's how the SPY pre-market set up. Vertical lines on the 5-min chart being possible triggers to entry, the last of which was the market open.

The ES shows the whole picture a bit clearer


The ES shows the whole picture a bit clearer

Saturday, December 10, 2011
2c
Examples of the 2c setup.
Being that the pre-market is so active these days it has offered some good technical setups of which the Opening sequence is just a follow-through.
Here, the SPY opening move was a drive off of this trend line break (2c setup, reverse divergence)

Here is one which I traded but feel I got "lucky". In hindsight this market was an inside day and didn't offer that reverse divergence to act off of

Friday, December 9, 2011


either way
It seems a case can be made for either long or short at this point, depending largely on the time frame your context is framed in. Next year could really be setting up for a big move one way or the other.
From left to right we have the S&P500 monthly, followed by the weekly and daily charts.
For the bullish side we have:
- Higher time frame shows two very strong momentum moves up followed by divergent bearish moves (the most recent higher lows on lower momentum led to a buy divergence). We are currently setting up the 3rd momentum move up. Long term moving average is trending up.
- The weekly time frame is forming a 3d long setup with key resistance to overcome but giving price projections into the 1400s. Price is above longer-term moving average and trying to build value higher on the short & intermediate term moving averages.
- Daily time frame had a very strong bullish momentum move right up against the 200-day MA. Price is pulling back in a very shallow price range (correcting in time rather than through price) building strength for the next move. Short & Intermediate moving averages are oriented bullish as well.
For the bears:
- The monthly time frame indicates impending bullish momentum, but this momentum can diverge (for instance say we test 1400 and momentum is weaker than previous), or not diverge (giving us the right shoulder of a H&S pattern). Either instance leads to a 2b short setup which are always tops. The intermediate moving average is trending down into the long-term average (perhaps the first time the 50- & 200-month moving averages will have ever touched?).
- Making it above 1300 is half the battle, but doing so steadily with modest corrections lower is healthy. It took 9-weeks to establish this range higher above 1200. All moving averages are sloping down with the intermediate period average trying to level out.
- The daily momentum is divergent (higher momentum, lower price). Price is below a down-sloping 200-period moving average.

Another bearish thought is what follows on the monthly chart. A lower low isn't bullish. The '08-'09 momentum move (lower low) was very much bearish, and the '09-'11 move which followed was corrective in nature. So, price could fall into this very long-term triangle. That wouldn't necessarily be end-of-the-world bearish, but it would result in a long-term digestive phase that is more aligned with its life-long trend line.


4c
Yesterday's multiple time frame chart. Trend day down, best entries were to fade the pullbacks to the Open and IB-low. "Triggered" trades occurred a couple of bars after those failed tests, a 4c-4d-4c continuation setup:


Thursday, December 8, 2011

Wednesday, December 7, 2011


some charts
SPY daily, trying to recover this "neckline"

ES consolidating under resistance. Tried to break down today but squeezed short positions. Can go either way as is the case when the market waits on news.

SPY today S/R levels came into play from the previous day and the lows tested prices from 12/02


ES consolidating under resistance. Tried to break down today but squeezed short positions. Can go either way as is the case when the market waits on news.

SPY today S/R levels came into play from the previous day and the lows tested prices from 12/02


Tuesday, December 6, 2011
12/6
Inside day.
A number of fake moves for most of the day. The Opening price acted as main pivot.
White lines are S/R from previous day/s. Purple line is intraday S/R.
A/D-line popped strong above the zero-line on the day's breakout (confirming). I was short just above $127 but really didn't capture the move down because of poor exits above 126.6.

3d setup played out (inverse Head & Shoulders) vertical lines being potential entries. I was long around the midpoint ($126.06) but....

... again didn't capture the strength of the move due to poor execution. Definitely need to work on this issue, all b/c I'm too over-focused on the fast time frame and not seeing the forest for the trees.
Here's another look at S/R points today, again, white lines from previous days. purple lines from the current day, yellow dash line was over-night high:

Monday, December 5, 2011
12/5
Previous levels which came into play today:

The white lines indicate levels of interest (Support/Resistance). The purple lines where intraday points.


The white lines indicate levels of interest (Support/Resistance). The purple lines where intraday points.

Friday, December 2, 2011
S/R
SPY traded price ranges from 11/15, 11/16, and 12/1

S/R levels from 11/15-16

Adding S/R levels from previous two days we have this (green horizontal lines)

Put them together for today, you have this:

So, if price has been tested I can terminate the previous price level and add new ones in as they become significant (white lines). Not perfect, but what is? The results are helpful though and at time uncanny.

Thursday, December 1, 2011
SPY
Moves to the A/D zero-line while fading resistance worked well today. As the previous day was an extreme advancing day the 124.45 area was a previous day break-out level.


trend continuation
Added the ADX in the 15 min chart to indicate the concept as mentioned over the weekend.

It looks as thought today's move could have been a short squeeze as price is narrowing into a rising wedge on not so wonderful volume. Not that it couldn't gap higher and squeeze higher, just that the structure seems weak:

Compared to the last time price rebounded off the 200-MA, forming the perfect seed wave on a 3d setup

TLT support
Decent support level in the TLT being around $116.

3d long setup (best time of day for them is around 1:30 CST)


3d long setup (best time of day for them is around 1:30 CST)

Wednesday, November 30, 2011
2c AMZN
Here was a 2c setup gone wrong. At least I THOUGHT it was a 2c setup, but the "trend" was certainly not decided at this point. As the breakout failed (stopped out) I turned short quickly as the setup morphed into 2c-2d-4c continuation short setup...essentially sloppy and not worth the trade. $195 overhead looks to be a significant level for AMZN...keeping an eye on it.


2c
AAPL ....adding this for the sake of having it on here. 2c long entry. Price pulling back in a bullish trend. Price forms somewhat of an inverted Head & Shoulders, or three-pushes to a low sequence.

Also, something which stood out for me was the symmetrical cycles which formed, wherein I harken back to the 'ol Stevenson PTT concept. Red lines are targets based off of the previous cycle and the purple line was the CTL which triggers a long entry. I actually traded this for a tiny gain as I covered almost to the tick before it rocketed higher....very frustrating


Also, something which stood out for me was the symmetrical cycles which formed, wherein I harken back to the 'ol Stevenson PTT concept. Red lines are targets based off of the previous cycle and the purple line was the CTL which triggers a long entry. I actually traded this for a tiny gain as I covered almost to the tick before it rocketed higher....very frustrating

bull squeeze
The day in the SPY as it unfolded. The vertical lines correspond to buying points on negative TICK readings once the market began to consolidate, but the payoff wasn't very rewarding throughout the afternoon (scalps for 15-25-cents).
I had a resting bid in at $123.86 (corresponding to the 9:30 breakout point) and sold it at IB high only to buy back higher (around vwap) as the market character began to change (forming that triangular seed wave). The position was taken off in full acci-fucking-dentally! near the highs of the day on an extreme TICK (meant to only take half). All-in-all an extremely disappointing performance today on a day that rewarded patience.

I had a resting bid in at $123.86 (corresponding to the 9:30 breakout point) and sold it at IB high only to buy back higher (around vwap) as the market character began to change (forming that triangular seed wave). The position was taken off in full acci-fucking-dentally! near the highs of the day on an extreme TICK (meant to only take half). All-in-all an extremely disappointing performance today on a day that rewarded patience.

unreal
Have been watching this 3d set up on the SPY weekly figuring it might initiate a long signal in a week or so, but today's daily action was a trigger to enter long. A pullback on the daily may take a while, but this higher time frame momentum wave is a doozy if there is follow-through overhead.


Tuesday, November 29, 2011
Review
Continuation move off of the previous day's late afternoon momentum.
Some points to observe:
1). Opening gap-fill followed by a rally, notice how the A/D pulls back to the zero line, finding support.
2). First failed higher high & low on a waning TICK & A/D line.
3). Price pulls back to vwap on an extreme negative TICK reading (also coinciding with a 50% retracement of the opening momentum, as well as a pullback in the A/D line to +200 support, which is a bit better than neutral, a moderately bullish breadth.
4). Price attempts to extend the rally but fails at the initial lower high's breakdown point.
5). A higher low for both price and TICK at vwap (which coincides with a previous higher low & breakout point). Also continued support at the +200 A/D line leading to a triangle in price.
6). Triangle fails to break higher and A/D line fails to hold support (which then turns to resistance). Leading to an A-B-C corrective wave.
7). Lower lows in TICK higher lows in price. A seed wave forms on a +TICK divergence (support at the A/D zero-line as well).
8) Price rallies higher to test upward breakdown levels (shorts covering as a higher low becomes more confirmed). Also, the A/D line runs back to +200 where it pulls back off of (on an extreme +TICK reading), then attempts to break again, but fails. Price settles nearly to the penny of where it opened. Nothing gained, nothing lost and yet consisting of so much drama.

Subscribe to:
Posts (Atom)