A couple of updated charts:
The IWM is back inside it's long-term pitchfork (though tired as it looks), as updated
from this post
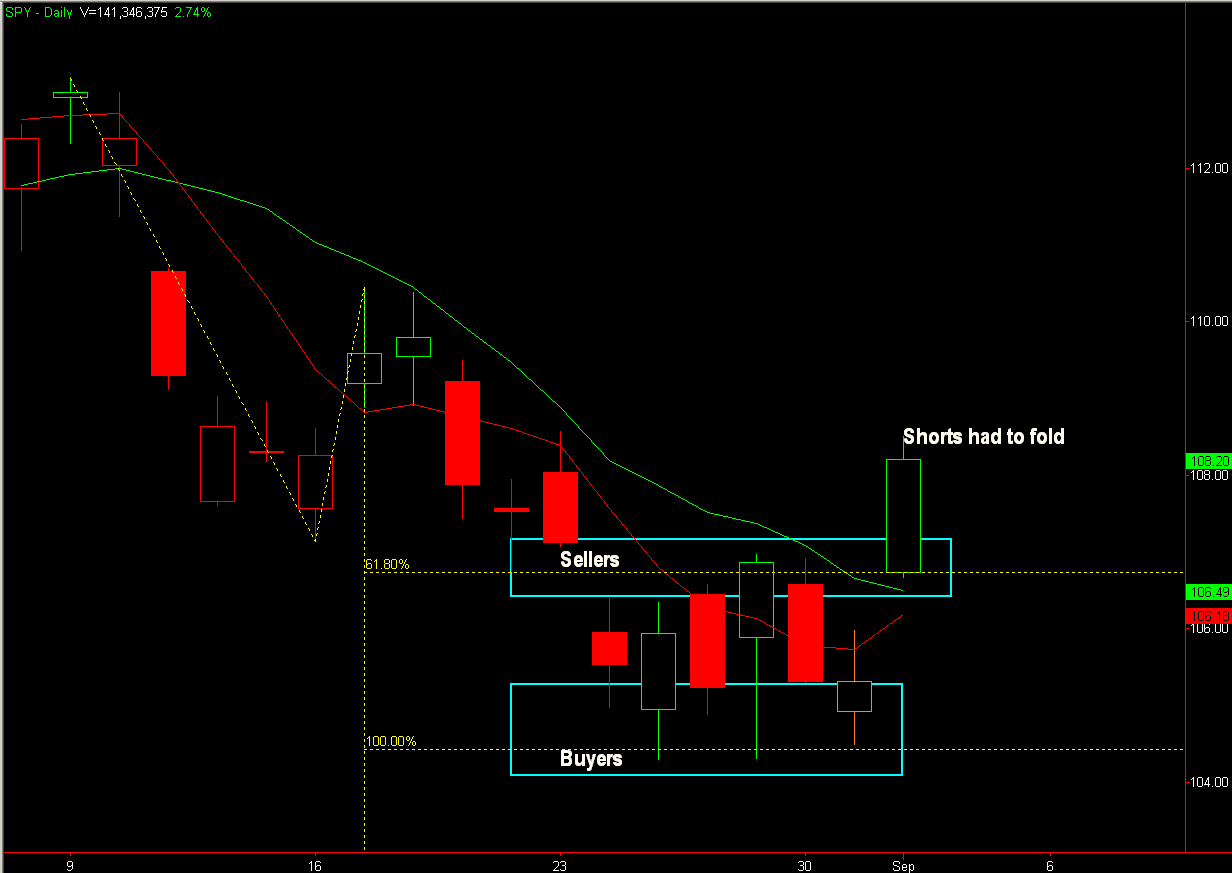
While the shorter-term pitchfork shows the SPY making a move toward it's mid-line, which happens to coincide with a 200-day MA (and a lower high incidentally).

The momentum buy divergence
as mentioned in this post, while giving some heat, did work out. The stop loss order should have been below the entry bar's low anyway.

The markets bounced with some momentum this week as we were looking for
from this chart but it's all about the follow-through up to and/or over $113

and how about that Lehman gap, I mean come on!

All-in-all we've been inside this range for quite some time, and could be here for more time to come. We could even look at price as if it were an unbounded oscillator, with the overbought/oversold levels shown by the red and green horizontal lines respectively (and keeping in mind that a market can remain overbought, or oversold, for long stretches of time as it did in March-April).


 While the shorter-term pitchfork shows the SPY making a move toward it's mid-line, which happens to coincide with a 200-day MA (and a lower high incidentally).
 The momentum buy divergence as mentioned in this post, while giving some heat, did work out. The stop loss order should have been below the entry bar's low anyway.
 The markets bounced with some momentum this week as we were looking for from this chart but it's all about the follow-through up to and/or over $113
 and how about that Lehman gap, I mean come on!
 All-in-all we've been inside this range for quite some time, and could be here for more time to come. We could even look at price as if it were an unbounded oscillator, with the overbought/oversold levels shown by the red and green horizontal lines respectively (and keeping in mind that a market can remain overbought, or oversold, for long stretches of time as it did in March-April).


 unless we use the flash-crash lows for the QQQQ
 or, we can use the flash-crash as our low for the longer-term pitchfork
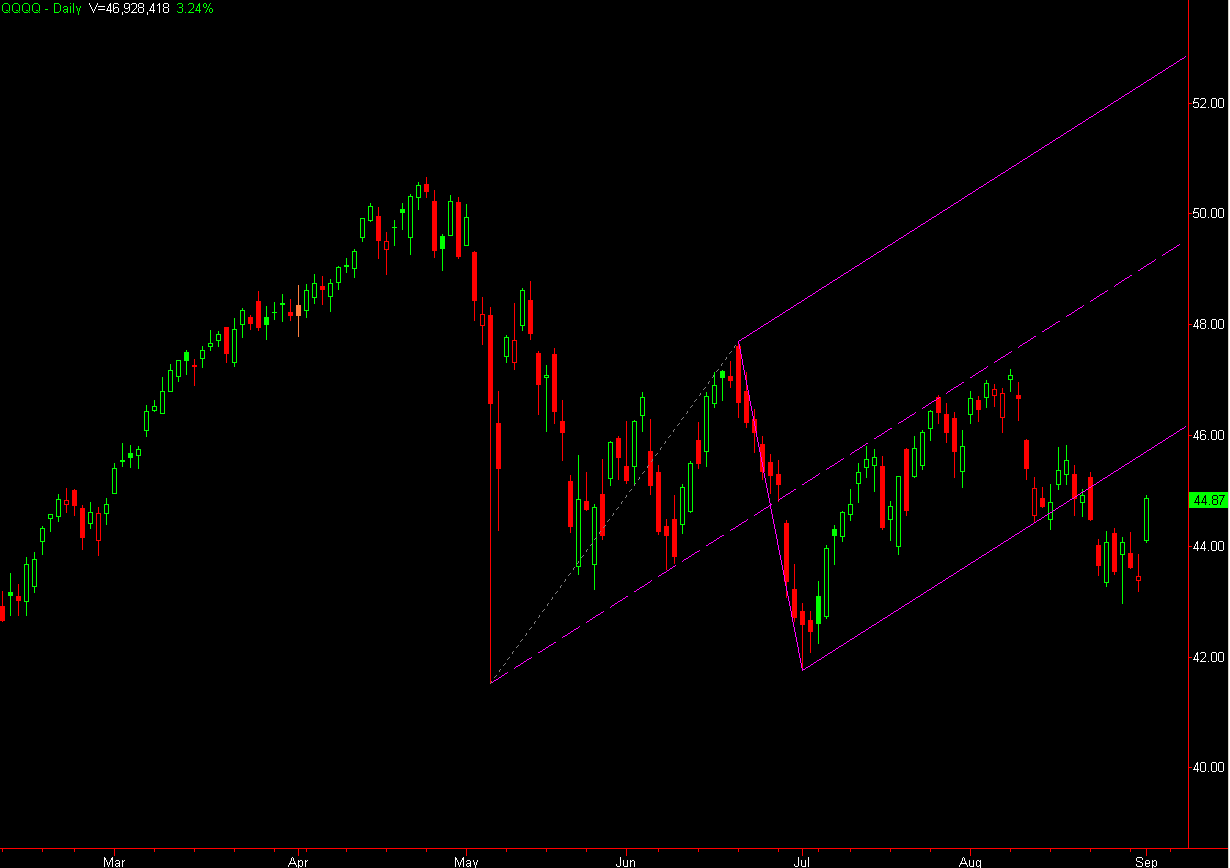 While the IWM is in snap-back mode

