The setups I include on this blog are used in conjunction with the 3/10macd and the criteria I ascribe to it as a way to alert me to an existing condition of price. The key concept to take away from this blog is that I try to anticipate what will happen on the higher time frame by using a faster time frame to trigger the trade setup. I do not trade a "system" I use two indicators to clue me in to price conditions. Please read the Disclaimer located in the sidebar of this site. I can be contacted via email at toddstrade@gmail.com
I am always open to questions, comments, or suggestions on how to improve this blog.


Showing posts with label charts. Show all posts

Saturday, December 11, 2010

Healthcare sector lit up

CYH's bid for THC brought some attention to the XLV this past week.
Currently XLV is down 1.5% for 2010 (the most lagging of the 10 most tracked sectors, followed by Utilities, XLU and Financials, XLF).

weekly charts showing all sorts of inverted H&S patterns with an overhead neckline:
XLV -Could have a breakout move in the week ahead

CYH, of course that big move all happened in one day though-
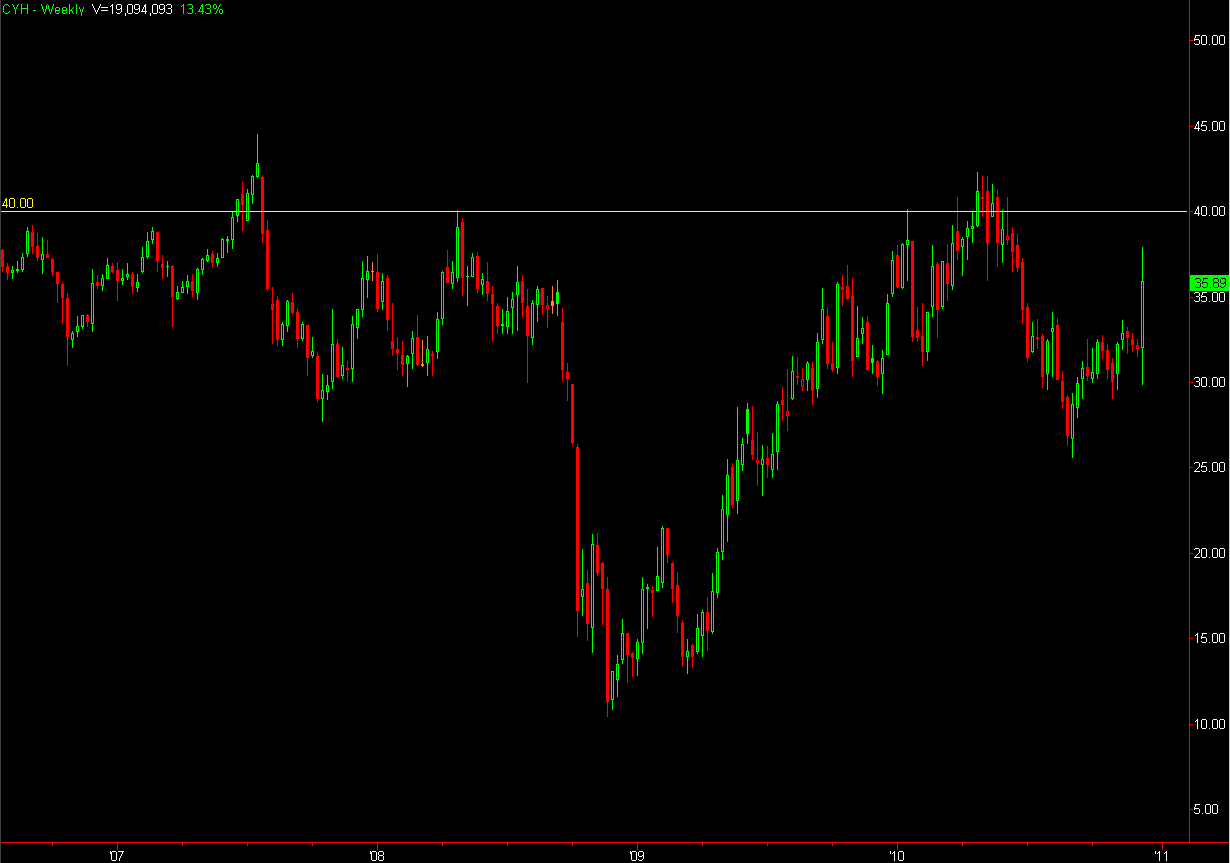

THC again, a one-move wonder on Friday-


While other components of the XLY show some promise.
A lot of clear air above for UNH


MRK - broke out from this W-bottom pattern and looks to try to regain $36.50 support

AMGN - formed a hook (seed wave) with what looks like a breakout candle on Friday

PFE is interesting.  This weekly chart shows a large amount of volume over these past two years.  While price recently broke out of and re-tested this LONG-standing down trend line

Tuesday, November 30, 2010

charts

posted some charts over at Chart.ly

and added notes onto the Fib. document.

Friday, June 4, 2010

abyss _ updated

{updated chart below}
$SPY about to enter down the rabbit hole....what will be on the other side? Sell or Buy tomorrow's employment numbers???


Thursday, May 27, 2010

Transports

Dow Jones Transportation Index (or the IYT etf) Were a good tell today.
Before the breakoutAfter the breakout

Tuesday, April 6, 2010

Just some charts

The inverse correlation between bonds and equities continues. The chart below using TLT and SPY as a proxy for Treasuries and the S&P respectively:Curiously, the 10-yr just broke down from an Andrews Trigger Line

The SPY just keeps creeping up the Lower Median Line as
And the Q's, well a move up into the warning zone (right around $50) in the past has resulted in some unbearably choppy price behavior.

Wednesday, February 10, 2010

charts

Bonds (TLT as proxy) look quite bearish:Wound pretty tightly (VXX):hmmmm, bull flag (GLD)?Can go either way (UUP):Still a good 150-points before testing the previous swing low (DIA):

Friday, January 29, 2010

log form

As we end the trading month of January, here's a look at some monthly charts, in log format:
Dow Jones Industrial Average:S&P500
Nasdaq Composite:Russell2000:and finally, the U.S. Dollar Index:

Wednesday, December 16, 2009

curious

Earlier today the Time & Sales on the SPY flashed three orders (just after 2p.m.) that totaled 10-million shares that were well below the market ($111.2854). The condition that this registers reads as "Filtered from Chart" and can mean at least two things as I understand it; bad ticks, resulting from an error in the data feed's algorithm, or a spread trade being transacted.Now, I'm assuming this must be an error in the data that's been filtered out, as the volume being filtered is way beyond the total shares registered at the times transacted. However, were did the SPY find support today? 111.28 of course! So, what gives?

Monday, December 14, 2009

gap, gap, and away!

Where is this thing going, why, and how? (aside from the obvious; up, because it wants to, and for no "good" reason).very little selling these last 3 gap-up sessions. The previous 3 gap-up sessions were sold pretty strongly.

Friday, November 13, 2009

Friday 11/13

In the last 8 sessions the SPY has gained 6.98% and in the last 3 sessions it retraced no more than 1.87%. Things can go either way, but mostly feels like it's hanging by a thread as it waits for the next surge of buying.
This morning's test of the previous day's low was met with very strong volume:
The chart below has horizontal lines indicating the previous day's Open/High/Low/Close.
Of particular interest are the day's momentum divergences and First Cross entry signals. Also the fact that price was rejected from the PDO after basing around it for an hour.It's also interesting to observe how much price has moved in these last three days. Key in on the 78.6% retracement zone.On the 15-min chart we closed above our bullishly oriented Moving Averages (though if you use Simple Moving Averages price is wedged between the two MA's, so whatever). Price has retraced over 38% from our lows by today's close. Perhaps Monday we'll see a gap or move up to test the $110 price, being that we spent so much time around it today and Wednesday.
The weekly is interesting; showing those momentum divergences since March. March through July gave two divergent impulse pushes following a small window of downside momentum (which only amounted to a 7% correction). From mid-July to the end of this week, we have had two similar (and smaller still) divergent impulse pushes, and while price closed at it's highest price since October '08 it has barely any momentum left in it. Either we get more impulse up or correct another 7%, but something's got to give.

Wednesday, October 28, 2009

More Monthlies

A couple more Monthly charts to take in:
GEGS
BACINTCAAPLHPQ

Owned

Bulls were owned today while looking for a dip to buy. You only really need to see one chart from today; that being the SPY with TICK distribution, unbelievable:We've nearly filled the gap left from earlier this month:We did breach the trendline in place since the March lows on strong momentum.
Speaking of trendlines, let's look at other markets with a similar theme:
There's the IWM trend broken, ouch!
Ditto the Q's:
The DIA, however, is lagging (but then look at some of the stocks that comprise the Dow Jones Industrial Average, who wants half of 'em?):The Dow Jones Transportation Index leading the way:
These trendline breaches are important in the sense that when we do "bounce" we'll have to watch how these trendlines are tested and/or recovered. Take the Dow Jones Utilities Index for example. It breached its trendline, "bounced" back in an attempt to recover the trendline, only to fail.Watch for snap-backs to these broken trendlines and whether they can recover or if they're seen as opportunities to sell.