A playback of the SPY today, Friday August 31. Jackson Hole symposium as well as end-of-month. Horizontal lines on the chart indicate the following:
Dotted Fuchsia = IB_high/low Solid Blue = o/s_high/low
Dotted Black = today's Open Solid Purple = o/n_high/low
Fib projections based on overnight high/low range.
Click in lower right to enlarge full-screen.

Friday, August 31, 2012
Thursday, August 30, 2012
testing lower
The SPY is testing lower and possibly going into the "C" point of an ABC correction. The daily 3/10 macd is oriented in the 2c-2d configuration (bullish trend, where we look for an inverse H&S, 3-pushes to a low, or an otherwise higher low seed wave), which I've mentioned before puts one on the lookout for a 3d setup on the faster time frame. We did see the 3d setting up on the faster time frame in the chart below, however price rolled over.
Highlighted below, in the 130m chart, we see the same pattern as what looks to be taking place on the higher time frame daily chart. So, the next bounce from support could take us back to $142 over time (which is strong resistance). If the 3/10macd doesn't indicate very strong positive momentum going forward things can set up a 2b bearish criteria.

Highlighted below, in the 130m chart, we see the same pattern as what looks to be taking place on the higher time frame daily chart. So, the next bounce from support could take us back to $142 over time (which is strong resistance). If the 3/10macd doesn't indicate very strong positive momentum going forward things can set up a 2b bearish criteria.

replay
I've been trying to get the dimensions and resolution right for a video playback, so this is just a test. Click in lower right corner to view full screen. Let me know if you have any suggestions regarding playback; too slow? Needs music? Draw on the charts as it's being played back?
Here is a key to what the horizontal lines represent:

Here is a key to what the horizontal lines represent:


Wednesday, August 29, 2012
SPY replay
Here is a 5-min chart of the SPY with TICK.


Here is a key for the above charts so you know what the lines and dots represent:
The numbers are there to highlight the following:
1). An attempted break from the opening swing on very marginal TICK.
2). Higher TICK high, lower price highs (reverse div.).
3). A test of the overnight lows which occurs on a positive TICK divergence.
4). Higher TICK highs on the re-test of previous selling point, but notice how price stabilizes as TICK pulls back to the zero-line.
5). Higher price highs (to a 25% projection of the overnight range) on lower TICK highs (negative divergence).
some charts
Choppy end-of-month (and pre-holiday) price behavior. So here are a few charts.
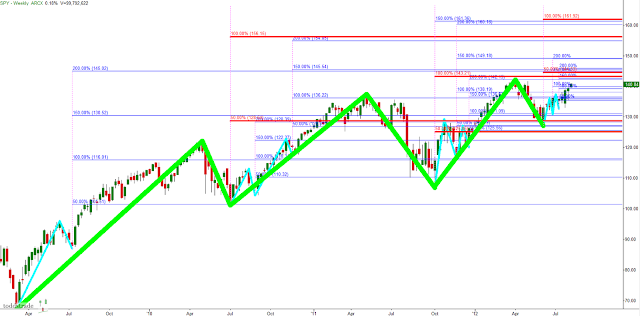
First, a weekly of the SPY showing that we're essentially rotating inside the real-body of the previous week's high-wave doji.

Seeing an inverse H&S (which is what the 3d setup often highlights) on the higher time frame with over $142 being the actionable neckline.

Finally, a look at the 20-day percentage performance of the sector-ETF's; XLK & XLY continue to hold up well.

Tuesday, August 28, 2012
previous setups
Wanted to just post a couple setup examples that occurred the previous two sessions in the SPY.
From Friday:
3-pushes to a low. Multiple positive divergence, the last one being a 3d setup (there's also a 4d-4c continuation flag setup on the 23rd)

The next day (Monday) was followed by a 2c/2d setup (with a very late triggered entry) that failed to break through resistance. Later in the day there was a short opportunity in the form of a 2d-2c bearish continuation

Sunday, August 26, 2012
resistance
An update on this weekly chart of the SPY. Some hesitation (high wave candlestick) going into that resistance zone overhead. Above $143 has a lot of clear air until the next supply level around $147. Next week is shortened (Labor Day) so it's possible we get a move that sets up next week's action but also leaves Friday's trade as consolidative in nature.


Friday, August 24, 2012
divergence
Just because there exists a divergence doesn't mean price can't continue higher. A perfect example of that today in the SPY and the NYSE TICK.
Sorry for the busy chart. As an aside, the first highlighted region on the TICK chart was not a divergence. What followed, were TICK divergences, which led to subtle price pullbacks but ultimately continued breaking out. Notice how TICK held the zero-line on each pullback.

Sorry for the busy chart. As an aside, the first highlighted region on the TICK chart was not a divergence. What followed, were TICK divergences, which led to subtle price pullbacks but ultimately continued breaking out. Notice how TICK held the zero-line on each pullback.

Wednesday, August 22, 2012
trend
A look at the recent trend development in the SPY. When in a trend (as defined by the Moving Averages you like to use) we can look to buy the pullbacks that I label as 2c-2d criteria. There are also Fibonacci price projections plotted on the 60min chart (left) to give a guideline for targets.
On the faster time frame (right) you're looking for a 3d setup or fast line pullback into a positive sloping slow line which often takes on the characteristics of an inverse H&S or a 3-push pattern.
The highlighted regions are to show 50 & 100% projections, but also price holding a 50% retracement of the initial impulse move.

Tuesday, August 21, 2012

Friday, August 17, 2012
day after trend
Keep in mind: the sub-chart of the TICK has a number of horizontal lines; zero-line being teal colored, + & - 500 = neutral zone green or red dash lines, + & - 800 = general bullish/bearish are solid green or red, and + & - 1000 = extreme bullish/bearish are a green or red horizontal line.
Notice that today's TICK only got down to barely -500 which is very bullish.
Below is a chart of the SPY with TICK, the numbers 1-5 indicating setups one might look for:
1). The first higher low which followed a new TICK low, notice the strength of the green bar which cemented the higher low.
2). Profit taking at resistance on a negative TICK divergence. Notice the lower wick on the red bar under the "#2" indicating the profit taking sellers which follow this methodology.
3). Price tests support on a new TICK low which is faded.
4). Price re-tests resistance and breaks out, but on a negative TICK divergence (harami reversal bar).
5). Price tests support on lower TICK lows (reverse divergence), the strong reversal bar which followed giving a strong follow-through move in the last 15-30 minutes back to the Open price on a new TICK high (wherein profits were taken into the close, as is evident by the long selling wick on the last 5-min bar).

Fri 8_17
Coming into the supply point which began the lower high sell-off in May of '08. This thing could. go. all. the. way!


Tuesday, August 14, 2012
SPY S_R
Updated from below with today's price action. Strong bounce at the low volume node at the end of day to close on the same price as yesterday.

Below is the original chart i posted this morning:
Something I was working on for Support/Resistance levels going forward.


Below is the original chart i posted this morning:
Something I was working on for Support/Resistance levels going forward.

Monday, August 13, 2012
geometry of a reversal
This is one of the most prevalent reversal cycle structures in the market (at least that's how I feel).

and here's a look with today's @ES_F

and with volume

and 1 more chart with the main breakdown pivots


and here's a look with today's @ES_F

and with volume

and 1 more chart with the main breakdown pivots

Mon 08_13
Just a chart of the SPY with overnight range (fuchsia) and opening swing (teal).

As an aside, here's a look at the recent SPY cycles. Very symmetrical with the Regular and Inverted cycles being of nearly equal length (about 1 trading day as there are 26 15-min bars/day). The coil continues.


As an aside, here's a look at the recent SPY cycles. Very symmetrical with the Regular and Inverted cycles being of nearly equal length (about 1 trading day as there are 26 15-min bars/day). The coil continues.

Saturday, August 11, 2012
into resistance
We're right into resistance; 1% from fresh post-Lehman highs and 10.5% from all-time highs on the SPY (weekly charts below). We either get a strong momentum bar to breakout (getting very extended and compounding a short squeeze) or we fade to entice buyers.
There are often dual levels of resistance in these circumstances, coinciding with previous breakdown points. Interestingly, the previous 2 breakout to new high attempts were faded for larger corrections.

We also appear to be forming smaller seed waves which kick off these measured moves to higher highs. Below is a chart with Fibonacci projections based on the highlighted seed waves (7 of them):

The chart below adds in the 3 larger cycle moves (green) with red Fib. projections. The $143-$146 area has a good deal of Fib. confluence:
In the grand scheme of things, this monthly chart below we can see price has done a good job in filling in the previous momentum selling that began in June of '08. Price could stand to test lower for constructive price discovery, particularly given the importance of the overhead price levels which previously resulted in a double top. Trends end in a climax, and in my opinion we haven't seen one yet.

At any rate, the longer we take to test the $154.50 area, the better for sustained trend development. Keep an eye on the VIX going forward, which hasn't given any hints at a correction, though is holding a higher low (weekly) while the S&P holds this current lower high.
There are often dual levels of resistance in these circumstances, coinciding with previous breakdown points. Interestingly, the previous 2 breakout to new high attempts were faded for larger corrections.

We also appear to be forming smaller seed waves which kick off these measured moves to higher highs. Below is a chart with Fibonacci projections based on the highlighted seed waves (7 of them):

The chart below adds in the 3 larger cycle moves (green) with red Fib. projections. The $143-$146 area has a good deal of Fib. confluence:

In the grand scheme of things, this monthly chart below we can see price has done a good job in filling in the previous momentum selling that began in June of '08. Price could stand to test lower for constructive price discovery, particularly given the importance of the overhead price levels which previously resulted in a double top. Trends end in a climax, and in my opinion we haven't seen one yet.

At any rate, the longer we take to test the $154.50 area, the better for sustained trend development. Keep an eye on the VIX going forward, which hasn't given any hints at a correction, though is holding a higher low (weekly) while the S&P holds this current lower high.
Wednesday, August 8, 2012
SPY Channel
The SPY 130 minute chart (130 minutes because there are 3, 130-minute bars in one day; at least in a day that operates under regular trading hours).
The Red/Green vertical lines indicate when the fast line and slow line cross on the 3/10macd (green indicating a cross with a bullish bias, red indicating a cross with a bearish bias). Interesting how they all correspond to a trend line break.

The Red/Green vertical lines indicate when the fast line and slow line cross on the 3/10macd (green indicating a cross with a bullish bias, red indicating a cross with a bearish bias). Interesting how they all correspond to a trend line break.

Thursday, August 2, 2012
wide range
A very wide overnight range due to the ECB puppet show. With such a wide range I like to include a 25% Fib. projection to give a more reasonable initial target should the o/n low break. Missed it by 3-cents in this case.
Nice pullback off the Open (vertical blue dash line) to the o/n_range midpoint. There are two 3/10macd indicators on this chart, the top one just reflects the 15-minute time frame while the bottom one reflects the 5-minute.

Nice pullback off the Open (vertical blue dash line) to the o/n_range midpoint. There are two 3/10macd indicators on this chart, the top one just reflects the 15-minute time frame while the bottom one reflects the 5-minute.

Subscribe to:
Posts (Atom)