Is it worth living here? I'm beginning to weigh the pros and cons.
Does raising taxes really generate the projected state/local revenues, or do people just spend less?
Anyway, my local sales tax is being increased to 8.75%!
"The sales tax is expected to bring in an estimated $5.8-billion..."
Are these expectations based on current spending trends, or do they also take into consideration a likely decrease in overall consumer spending?
In all, Governor and lawmakers agreed to $12.5-billion in tax increases in an attempt to decrease the $42-billion deficit.
On top of a higher sales tax, California will impose a 0.25% increase in personal income tax rates in '09 & '10, AND a 0.5% increase in fees to license vehicles .
Also, there will be a tax increase which will reduce the "dependent care credit parents and caregivers can claim to $99 from $309."
"Governor Schwarzenegger abhors taxes. Always has, always will," said his finance spokesman.

Tuesday, March 31, 2009
Can't Reclaim the 50EMA
The trend to the upside today seemed indecisive until later in the day (around 1:30EST) after breaking a resistance base. Three "First Cross" signals today; the first green vertical line for a long position was actually triggered based on the open, but it was preferable to wait for a pullback before going long on the close of the 7th bar in this 5-min chart.
 The second long (2nd green vertical line) came after an NR7 (pink doji candle before the green line). While the last trigger was given right before the end of the day, so you could possibly have attempted a scalp, but those last 15-minutes of the day can be tricky and untrustworthy.
Meanwhile, on the 15-min chart we got one "First Cross" entry long (most recent green vertical line) that was followed by a buy signal based on the close above the WR7 (blue bar) within the first two bars (I mentioned this strategy in yesterday's post) that was actually an NR7! If you could follow that! I mentioned yesterday the potential for a "Slingshot" setup in today's tape based on the 60-min chart. We did get a snap back move back up to previous resistance and worked really well. Could be approaching the neckline of a Head and Shoulders pattern.
 The Daily shows a close below the 50-EMA, hard as it may have tried. Leaving us a partial gap fill and doji star type candle that makes me suspect a retest of the trend line directly below.
 The second long (2nd green vertical line) came after an NR7 (pink doji candle before the green line). While the last trigger was given right before the end of the day, so you could possibly have attempted a scalp, but those last 15-minutes of the day can be tricky and untrustworthy.
Meanwhile, on the 15-min chart we got one "First Cross" entry long (most recent green vertical line) that was followed by a buy signal based on the close above the WR7 (blue bar) within the first two bars (I mentioned this strategy in yesterday's post) that was actually an NR7! If you could follow that!
 I mentioned yesterday the potential for a "Slingshot" setup in today's tape based on the 60-min chart. We did get a snap back move back up to previous resistance and worked really well. Could be approaching the neckline of a Head and Shoulders pattern.
 The Daily shows a close below the 50-EMA, hard as it may have tried. Leaving us a partial gap fill and doji star type candle that makes me suspect a retest of the trend line directly below.
Monday, March 30, 2009
back below the 50EMA
A gap-down across the board and trend day down. The SPY (5min) gapped down to S3 and early on we got a Descending Triangle breakdown just after 10:30EST. Most of the afternoon was spent in a pretty narrow channel, but for the most part the trend down was pretty symmetrical. We got two "First Cross" triggers today, the first one (green vertical line for a long) was ignored as the slope of the macd average was negative and practically below zero. The other signal (red vertical line short) worked out, but required either quick profit taking skills (a short trailing stop leash) or patience to get the most out of the move (personally I'm in the former camp).
 On our 15-min chart we see a total breakdown of our previous trending regression channel (so I started a new channel today), while the 20- & 50-EMAs crossed bearish on Friday. I added a component to my 15-min charts this weekend where the blue candles represent WR7 (widest range of the last 7 bars). The concept behind that is to sell a close lower than (or reverse for longs) the WR7 within the first few candles (preferably within two candles). As you can see, this morning's first 15-min candle was in fact a WR7 and selling the weakness was just like selling a bear-flag set-up.
As an aside, the purple candles on this chart indicate an NR7 - narrowest range of the last 7 candles.
 As for a longer perspective, here's the 60-min chart. What I'm going to be on the lookout for is a potential "Slingshot" setup; where we have just put in a higher low, while our momentum indicator put in a lower low; this has the potential to send price higher (even if by higher I mean only a retrace back to our 50-EMA before continuing lower).
 As far as the Daily is concerned; we closed back below the 50-EMA and look to test the trendline sometime soon, to see if it will hold support.
Friday, March 27, 2009
CHOP
A ridiculously choppy day today in the SPY. For as many "First Cross" triggers that were given today there were just as many reasons not to take them. Here on the 5-min chart, we had an early short trigger (first red vertical line of today's session), however we had a bullish momentum divergence on the low of the morning which turned price around.
The second trigger was valid (first green vertical line of the day's session, and you could have scalped a little out of it, broken even or scratched for a small loss. The next two triggers were the same scenario as the previous long (scalp, break-even, or scratch for a small loss). Nothing seemed to work today, unless you were quick and in scalp mode. There was a "Slingshot" setup short (where the momentum makes a higher high, but price is unable to follow-through and puts in a lower high). This set-up occurred at the right shoulder of the inverted H&S pattern (yet another set-up that didn't fully follow through. My brain hurts from this session today. The 15-min chart showed us a short "First Cross" trigger and a bearish crossover of the 20- & 50-EMA's.
The second trigger was valid (first green vertical line of the day's session, and you could have scalped a little out of it, broken even or scratched for a small loss. The next two triggers were the same scenario as the previous long (scalp, break-even, or scratch for a small loss). Nothing seemed to work today, unless you were quick and in scalp mode. There was a "Slingshot" setup short (where the momentum makes a higher high, but price is unable to follow-through and puts in a lower high). This set-up occurred at the right shoulder of the inverted H&S pattern (yet another set-up that didn't fully follow through. My brain hurts from this session today.
 The 15-min chart showed us a short "First Cross" trigger and a bearish crossover of the 20- & 50-EMA's.
Thursday, March 26, 2009
chop fest
A very choppy and confusing day (for me). The initial gap-fill attempt (on SPY) showed some dull volume while the TICK didn't get overly bearish. We got a little inverted head-and-shoulders pattern, but buying the neckline break of the pattern would have tested your patience all through the day. While most of the day was spent in a narrow range channel, there were clear examples of support becoming resistance and resistance becoming support.
In keeping a watch for the "First Cross" strategy, there was a long entry that was given at the first opening candle (so perhaps you could have just waited for a pullback from that level, which would have gotten you in at the early morning double-bottom). While the short entry towards the end of the day (red vertical line) didn't work out. However, notice that there was a "Slingshot" setup where price makes a higher low (in this case it was very marginally higher, almost a precisely equal low) and our momentum oscillator makes a lower low (lower momentum unable to drag price lower), which results in a "slingshot in price. The 15-min chart rode the mid-line as resistance all day long.
 The S&P500 is at an interesting area, where it looks like it just wants to tag 850 just for the heck of it.
 Do we get resistance from the trendline, or do we break it and get support?
 While most of the day was spent in a narrow range channel, there were clear examples of support becoming resistance and resistance becoming support.
In keeping a watch for the "First Cross" strategy, there was a long entry that was given at the first opening candle (so perhaps you could have just waited for a pullback from that level, which would have gotten you in at the early morning double-bottom). While the short entry towards the end of the day (red vertical line) didn't work out. However, notice that there was a "Slingshot" setup where price makes a higher low (in this case it was very marginally higher, almost a precisely equal low) and our momentum oscillator makes a lower low (lower momentum unable to drag price lower), which results in a "slingshot in price.
 The 15-min chart rode the mid-line as resistance all day long.
 The S&P500 is at an interesting area, where it looks like it just wants to tag 850 just for the heck of it.
 Do we get resistance from the trendline, or do we break it and get support?
Wednesday, March 25, 2009
Gap, Consolidate, Expand
Another G-C-E day (Gap, Consolidate, Expand). The first 20-minutes on a 5-minute chart of the SPY gave us a small ascending triangle before expanding upwards. A hesitation at R1 before a test of the highs from these past two sessions.
Here again on this chart I marked two instances where the "First Cross" occurred today. The first long entry (green vertical line) I didn't take as I'm not comfortable entering on the close of such a strong wide range candle that brought price up to the highs of the day. The second entry short (red vertical line) was a lot easier to consider, though it did take a while for the move to get going. Watching my 15-min chart we had an interesting performance. Price fell right down to the bottom regression-channel line, bounced, consolidated for a candle, dropped through and then snapped back; pretty impressive moves.
I also noticed something that I mentioned in yesterday's post regarding LBR's "Slingshot" strategy. The swing low on March 20th and today's swing low formed both (a) higher price low and (b) lower momentum low which did end up leading to a "slingshot" rally.
 Our longer-term perspective showed us a tag of the 50-EMA leading to a rally; intriguing.
 Attempting to see turning points in the market I try to gauge NYSE TICK, combined with SPY volume and price. On this chart below, we notice a progressive downward slope in the TICK with below average volume. As price began to sell off, volume increased and the TICK continued to reach lower lows. The successive lows in price occurred on lower volume, while TICK began to put in higher lows.
Here again on this chart I marked two instances where the "First Cross" occurred today. The first long entry (green vertical line) I didn't take as I'm not comfortable entering on the close of such a strong wide range candle that brought price up to the highs of the day. The second entry short (red vertical line) was a lot easier to consider, though it did take a while for the move to get going.
 Watching my 15-min chart we had an interesting performance. Price fell right down to the bottom regression-channel line, bounced, consolidated for a candle, dropped through and then snapped back; pretty impressive moves.
I also noticed something that I mentioned in yesterday's post regarding LBR's "Slingshot" strategy. The swing low on March 20th and today's swing low formed both (a) higher price low and (b) lower momentum low which did end up leading to a "slingshot" rally.
 Our longer-term perspective showed us a tag of the 50-EMA leading to a rally; intriguing.
 Attempting to see turning points in the market I try to gauge NYSE TICK, combined with SPY volume and price. On this chart below, we notice a progressive downward slope in the TICK with below average volume. As price began to sell off, volume increased and the TICK continued to reach lower lows. The successive lows in price occurred on lower volume, while TICK began to put in higher lows.
Tuesday, March 24, 2009
Slingshot setup
Today in the SPY we:
Gapped Down
Range-bound first half of the day
Tested the highs and lows
After such an impulse move to the upside yesterday we were to suspect a narrow, or range-bound day. Not sure why the sell-off at the end of the day, oh I know why; because we got a "First Cross" sell trigger!
Here's a 5-min chart of the SPY. We had three instances where the MacD average crossed the zero line, but only two of the three were legitimate triggers (because the first trigger, a short, the MacD average had a positive slope, not to mention vwap and moving average support). The other two triggers worked well, the end of day short didn't look like it was going to play out, but the bottom dropped out end-of-day.

I was listening to an audio presentation given by Linda-Bradford Raschke on ino TV, where she talks about a setup she calls a "Slingshot" trade. Of course this uses the momentum indicator on most of my charts, the 3-10 MacD (subgraph 1).
The rules of the "Slingshot" (Long entry) require;
A Higher Low in Price coinciding with a Lower Momentum Low.
So I just wanted to illustrate an example that I noticed for the SPY 60-min chart I have up. In this chart you can see two recent swing lows (March 17th and March 20th) that coincide with a lower momentum low. This behaviour led to a "Slingshot" in price (momentum could not drag down price). The question of course, is where/when do you decide to exit? Anyway, it's intriguing.

Monday, March 23, 2009
G C E
Gap
Consolidate
Expand
A large gap up to the previous session's open (above R1 and PP), price consolidated for the first 30-min before expanding, leading price higher all day with a number of periods of tight consolidation.
Here on this SPY 5-min chart I have marked the "First Cross" entries. One long entry from the previous session (15-min. before the close). The short entry (marked by a red vertical line) wasn't taken because of the confluence of support for price (R2, vwap, AND a 50-ema).
The green vertical line was a long entry that resulted in a rally into the end of the day up to R3. Here's a 15-min chart, again with the same "First Cross" entries marked in corresponding vertical lines.
 Longer term (60-min) we see the gap filled from Feb.17th.
 The S&P500 broke out of the down-trendline, next target would be the next, longer-term, trendline.
Consolidate
Expand
A large gap up to the previous session's open (above R1 and PP), price consolidated for the first 30-min before expanding, leading price higher all day with a number of periods of tight consolidation.
Here on this SPY 5-min chart I have marked the "First Cross" entries. One long entry from the previous session (15-min. before the close). The short entry (marked by a red vertical line) wasn't taken because of the confluence of support for price (R2, vwap, AND a 50-ema).
The green vertical line was a long entry that resulted in a rally into the end of the day up to R3.
 Here's a 15-min chart, again with the same "First Cross" entries marked in corresponding vertical lines.
 Longer term (60-min) we see the gap filled from Feb.17th.
 The S&P500 broke out of the down-trendline, next target would be the next, longer-term, trendline.
Friday, March 20, 2009
two up week's
The S&P500 index finished the week on a shooting star-like candle
 The Nasdaq Composite Index ended the week with a high-wave candle
 The Dow Jones Industrial ended the week on an NR7 shooting star,
 The Nasdaq Composite Index ended the week with a high-wave candle
 The Dow Jones Industrial ended the week on an NR7 shooting star,
abolish the Federal Reserve
It's a very long video, but very relevant. I listened to a lot of it while making lunch.
"I sincerely believe that banking institutions are more dangerous to our liberties than standing armies. The issuing power should be taken from the banks and restored to the people to whom it properly belongs."
- Thomas Jefferson
"If the American people ever allow private banks to control the issue of their currency, first by inflation, then by deflation, the banks and the corporations which grow up around them will deprive the people of all property until their children wake up homeless in the continent their fathers conquered."
-Thomas Jefferson
"I wish it were possible to obtain a single amendment to our Constitution - taking from the federal government their power of borrowing."
-Thomas Jefferson
Thursday, March 19, 2009
Dark Clouds and Shooting Stars
Two common themes I see on charts after today; Dark Cloud Cover and shooting star candlestick patterns.
The DIA and SPY both ended the day with a Dark Cloud Cover candlestick pattern.
XLB (Materials SPDR ETF), XLE (Energy Select SPDR ETF), and XLU (Utilities SPDR ETF) left us with shooting star patterns.
While XLI (Industrial SPDR ETF), XLF (Financial Select SPDR ETF), XLY (Consumer Discretionary SPDR ETF) gave us Dark Cloud Cover days.
Some interesting charts include:
AAPL - Ran up to resistance on less than stellar volume, it's either pop or drop from here FCX - Shooting star popped right at resistance on high volume
 OIH (Oil Services HLDR ETF) - Check out the major holdings here. Large volume shooting star. Also XLE and their major holdings.
 CF - Another move it or lose it candidate
The DIA and SPY both ended the day with a Dark Cloud Cover candlestick pattern.
XLB (Materials SPDR ETF), XLE (Energy Select SPDR ETF), and XLU (Utilities SPDR ETF) left us with shooting star patterns.
While XLI (Industrial SPDR ETF), XLF (Financial Select SPDR ETF), XLY (Consumer Discretionary SPDR ETF) gave us Dark Cloud Cover days.
Some interesting charts include:
AAPL - Ran up to resistance on less than stellar volume, it's either pop or drop from here
 FCX - Shooting star popped right at resistance on high volume
 OIH (Oil Services HLDR ETF) - Check out the major holdings here. Large volume shooting star. Also XLE and their major holdings.
 CF - Another move it or lose it candidate
Wednesday, March 18, 2009
Fed day
I'm not sure what to think if the recent Fed decision to buy Treasuries and prop up the markets. Things were pretty quiet most of the day, as is par for the course on a Fed day. While, of course, things exploded after 2:15.
Price chopped around vwap in the early morning. We had two instances of the "First Cross" setup in the SPY 5-minute chart today. One short, which you might have bailed on, broken even, or stopped out on. The success of the long entry might would have been dependent upon where you put your stop (it could have been pretty wide), but it would have been very profitable had you had the cajones to hold through the Fed speak. Price is back into our channel on the 15-min chart that was created at the beginning of this bull run.
 Where do we go from here? From a technical perspective it looks like we need to test/fill the gap left from Feb.17th (between $80.60-$82.35).
 SPY closed right above the 50-EMA, first time since the beginning of the year.
Meanwhile, here's the immediate effect of today's decision by the Fed.
Back into Gold and Treasuries
GLD TLT
TLT U.S.Dollar Index doomed?
Price chopped around vwap in the early morning. We had two instances of the "First Cross" setup in the SPY 5-minute chart today. One short, which you might have bailed on, broken even, or stopped out on. The success of the long entry might would have been dependent upon where you put your stop (it could have been pretty wide), but it would have been very profitable had you had the cajones to hold through the Fed speak.
 Price is back into our channel on the 15-min chart that was created at the beginning of this bull run.
 Where do we go from here? From a technical perspective it looks like we need to test/fill the gap left from Feb.17th (between $80.60-$82.35).
 SPY closed right above the 50-EMA, first time since the beginning of the year.
Meanwhile, here's the immediate effect of today's decision by the Fed.
Back into Gold and Treasuries
GLD
 TLT
TLT U.S.Dollar Index doomed?
Tuesday, March 17, 2009
freight train day
If you were getting short today, you might have gotten the feeling like you were playing chicken with a speeding freight train. I'm not sure if this week is mostly a result of quadruple witching on Friday, or if the bulls really do have this much conviction.
First thing to notice from this morning was the relatively positive TICK readings on a negative start to the day. Here's a 5-min chart of the SPY. I snapped a regression channel off of the first two swing lows (around 9:45 and 11:30 a.m. EST) while using 2 standard deviations. The result of which was very satisfying for the rest of the day. There was an opportunity to sell short at the top of the regression channel that coincided with R1. While there was a buying opportunity at the bottom of the regression channel coinciding with pivot support.
 In keeping with my post from yesterday regarding the "first cross method," today's tape in SPY provided two setups; one short, one long. The long opportunity you might have scaled out of and held some until end of day. If you took the short setup, you would have bailed on it.
Here's a look at the 15-min chart, where price recovered it's regression channel from the beginning of this rally. There's also a look at a "first cross" set-up that occurred today. Here's a longer perspective of the same chart.
 Finally, here's a look at the SPY 60-min chart (including the most recent long trigger using the aforementioned "first cross" method). Price pinned right up against resistance.
First thing to notice from this morning was the relatively positive TICK readings on a negative start to the day.
 Here's a 5-min chart of the SPY. I snapped a regression channel off of the first two swing lows (around 9:45 and 11:30 a.m. EST) while using 2 standard deviations. The result of which was very satisfying for the rest of the day. There was an opportunity to sell short at the top of the regression channel that coincided with R1. While there was a buying opportunity at the bottom of the regression channel coinciding with pivot support.
 In keeping with my post from yesterday regarding the "first cross method," today's tape in SPY provided two setups; one short, one long. The long opportunity you might have scaled out of and held some until end of day. If you took the short setup, you would have bailed on it.
Here's a look at the 15-min chart, where price recovered it's regression channel from the beginning of this rally. There's also a look at a "first cross" set-up that occurred today.
 Here's a longer perspective of the same chart.
 Finally, here's a look at the SPY 60-min chart (including the most recent long trigger using the aforementioned "first cross" method). Price pinned right up against resistance.
Monday, March 16, 2009
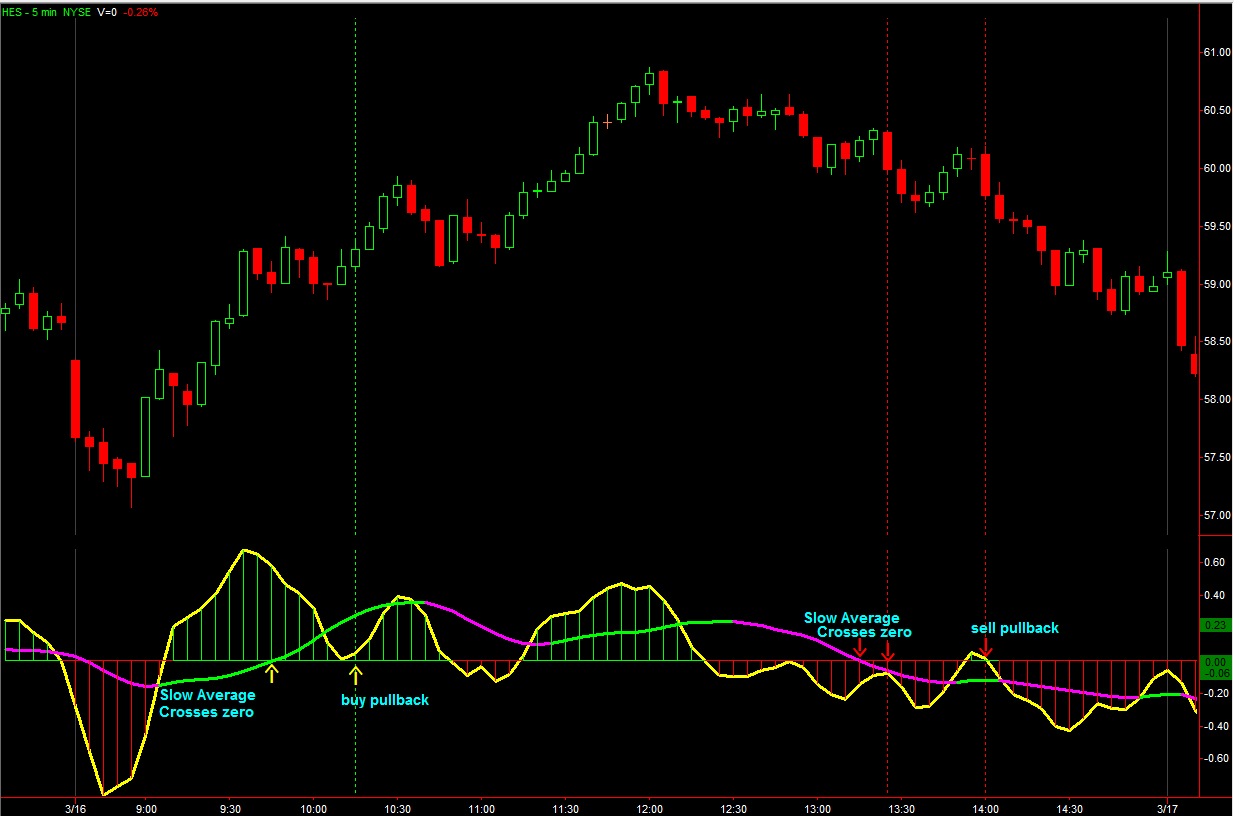
the 3-10 first cross
The "first-cross" method was something I became aware of through an audio presentation given by Linda-Bradford Raschke. This method uses the 3-10 momentum indicator (which you can read about thanks to AfraidtoTrade.com here and, to a lesser extent here).
The rules are simply (for a long position) buy the first pullback in the fast oscillator after the slow line crosses above zero for the first time. Obviously for a short the rules are simply the reverse; sell the first pullback in the oscillator after the slow line crosses below zero for the first time. Essentially, this method is indicating a higher high/lower high and, therefore, a place to enter a trend.
To demonstrate, here's a chart from today in HES. I didn't take the first long trade, but I did trade the short position later in the day.
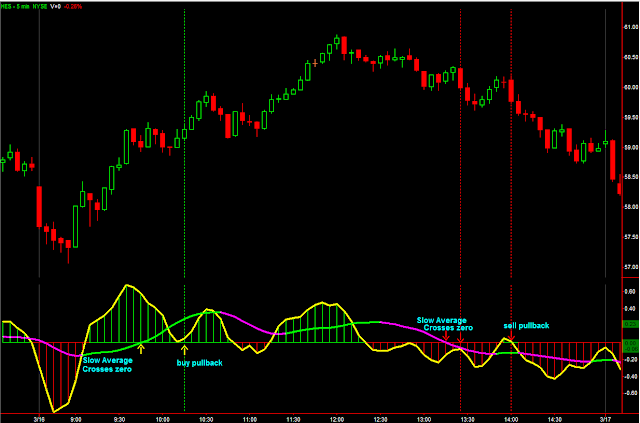
It can certainly be applied to any timeframe, so long as you adjust your risk management appropriately.
The rules are simply (for a long position) buy the first pullback in the fast oscillator after the slow line crosses above zero for the first time. Obviously for a short the rules are simply the reverse; sell the first pullback in the oscillator after the slow line crosses below zero for the first time. Essentially, this method is indicating a higher high/lower high and, therefore, a place to enter a trend.
To demonstrate, here's a chart from today in HES. I didn't take the first long trade, but I did trade the short position later in the day.
It can certainly be applied to any timeframe, so long as you adjust your risk management appropriately.
Q's lead weakness
Early weakness in the Q's this morning hinted at possible end-of-day failure, as the Q's led the markets in last week's rally. The final result for today on the Q's was a fairly strong bearish engulfing pattern on increased volume.
 While the Dow was up 80 points this morning and the SPY was in narrow consolidation, the Q's were testing previous session's lows. We had a W-(double) bottom with a bullish momentum divergence where price ended up closing on a lower low than the previous session.
 The SPY wasn't giving up throughout the day. The higher probability hint at weakness was the test of the highs on a bearish momentum divergence where price fell through my regression channel and came down to the day's pivot.
 Watching the SPY on a 1-minute chart today was pretty clean. On my 1-min chart I like to use an 89-EMA with a 34-EMA (Fibonacci numbers), while the sub-graph is a variation of an Accumulation/Distribution indicator. The third touch of the 89-EMA got me ready to go short, but actually provided yet another area to get long. Once the EMA's cross and price retraces and fails (as it did just before 3p.m.Eastern) it's time to go short (provided my ADA confirms, as it does in this case).
Friday, March 13, 2009
score 1 for the bulls
The weekly S&P500 left us with a bullish engulfing candle (if we don't consider the shadow of the previous candle, which isn't a necessary requirement).  While the Daily chart ended the week with a hanging man type candle, though it would have been a stronger signal/suggestion had it been a red candle.
 Meanwhile the daily SPY chart leaves us with a bearish long-legged doji, giving us a feeling of bearish leaning indecision.
 The trend continued to drift up today; we had a slip below the 20-EMA on the 15-min SPY, and I was looking for a tag of the 50-EMA, but didn't get the seller participation (such a beautiful trend along the regression channel).
 Looks really strong to close the week above $75.50
 The highs of the morning couldn't find much demand. We chopped down through previous support levels before coming to a "W"-bottom that coincided with a rounded bottom pattern on my momentum indicator.
 While the Daily chart ended the week with a hanging man type candle, though it would have been a stronger signal/suggestion had it been a red candle.
 Meanwhile the daily SPY chart leaves us with a bearish long-legged doji, giving us a feeling of bearish leaning indecision.
 The trend continued to drift up today; we had a slip below the 20-EMA on the 15-min SPY, and I was looking for a tag of the 50-EMA, but didn't get the seller participation (such a beautiful trend along the regression channel).
 Looks really strong to close the week above $75.50
 The highs of the morning couldn't find much demand. We chopped down through previous support levels before coming to a "W"-bottom that coincided with a rounded bottom pattern on my momentum indicator.
Subscribe to:
Posts (Atom)