The setups I include on this blog are used in conjunction with the 3/10macd and the criteria I ascribe to it as a way to alert me to an existing condition of price. The key concept to take away from this blog is that I try to anticipate what will happen on the higher time frame by using a faster time frame to trigger the trade setup. I do not trade a "system" I use two indicators to clue me in to price conditions. Please read the Disclaimer located in the sidebar of this site. I can be contacted via email at toddstrade@gmail.com
I am always open to questions, comments, or suggestions on how to improve this blog.


Thursday, January 31, 2013

EURUSD continues

I've been posting more on the EURUSD as this move has unfolded.
The weekly below (left) showing the inverse Head & Shoulders break where we'd be looking to 1.373 to achieve the 50% Fib. projection.  The trend on the daily showing bullish improvement, though be it a bit stretched.

A bit faster time frame, the trend is strongly bullish.  So you're looking to buy bullish orientation of the 3/10macd on the faster time frame.

Thur 1_31

today's trade:
A key for the above chart to define the horizontal lines and dots.  For further explanation, see this link:  


Aside from the morning short trade I got chopped up in the afternoon.  The Second short was about a point loss and the 3rd trade (long) was slightly better than b/e (bought 150.10-sold 150.12).   I wanted to try and get short into the close but the 2pm bar was too fast and the "triggers" didn't line up right.  Kept me out of a choppy environment into the month end close.

Higher time frame is looking a bit like a Head & Shoulders.  The slow line being dragged negative and price working inside the 20- & 50-MA "window".   The higher time frame would flip bullish if the 3/10macd fast line turns green (would need momentum over $150.25 coinciding with an overhead trend line break).
Otherwise we can see the 65-min 3/10macd fast line tick back down negative (likely on a $149.50 break).

If there's one thing that doesn't make sense to me, it's the QQQ.  It spent all year/month in a 2.5% range.  If it closes tomorrow around where it is now, the weekly would have a tri-star doji pattern within a Head & Shoulders.  From what I've seen, the QQQ often diverges from the other indexes (particularly the DIA)  before a turn.  Of course, anything over $67.50-$67.75 tomorrow would negate the above thought process.
First of the month on a "big #"  (NFP) should be a decent range day I would suppose.

Wednesday, January 30, 2013

Wed 01_30

today's trade:
A key for the above chart to define the horizontal lines and dots.  For further explanation, see this link:  


I don't care for being in the market during FOMC minutes, but once the dust settles a directional move can unfold.

I should have stayed more focused (patient) with the higher time frame unfolding.  Bear flag (channel) breakdown was fairly straight forward if you can ignore the noise.
The 65-min showing 2c-2d still, which would mean caution once we saw the 15min turn 3a criteria, while a long entry could form with the 3d criteria, but this will take time as the 15-min works off the bearish momentum (unless we have a V-bottom squeeze).  

A pullback from here is just that.  The momentum built up by this January move would take extreme momentum or a lengthy period of time to do real damage to it and create (higher time frame) sell setups.
Daily on the right in the chart below; that's a lot of bullish momentum that was formed this year.  So, we would be looking to buy the 2c-2d criteria going forward (in the same way I've been highlighting this criteria on the 65-min chart above.

EURUSD higher still

Previous EURUSD setup being the 2c-2d criteria showing a nice base break.  First trigger would have likely been a stop-out, but next two were decent

Tuesday, January 29, 2013

measured move

SPY measured move primary target (50% projection) is just overhead

Tue. 1_29

today's trade:
A key for the above chart to define the horizontal lines and dots.  For further explanation, see this link:  

Breakout again:

Higher time frame showing some selling tails on waning momentum (3-push).  The 15-min showing potential 2b selling (or at least not buying) criteria

Daily showing resemblance to the past few years, price riding the upper keltner channel (2.5ATR band)

Monday, January 28, 2013

Mon. 01_28

today's trade:
A key for the above chart to define the horizontal lines and dots.  For further explanation, see this link:  

Disappointed in not shorting the morning weakness

Higher time frame; breakout above $150.20 and below $149.50s

Price is now working sideways (accepted value area) and moving in relatively symmetrical cycles (coiling).  This should bring a momentum follow-through move in whichever direction it breaks

The longer this Head & Shoulders stays valid (invalid with a sustained move over $67.50-$68), the longer you have to wonder what a broad-based correction will look like

Saturday, January 26, 2013

EURUSD

I didn't update the EURUSD this week b/c it barely moved.  It did end  up breaking out of it's most recent range.
Closed right around resistance for the week and doesn't have much in the way overhead until about 1.38

The 240m did get a small 3d setup on the 24th.  You can see on the faster time frame how a number of prior buying impulses kept fading.  It was a challenging week if you were playing within that tight range.

Fri. 01_25

the day's trade:
A key for the above chart to define the horizontal lines and dots.  For further explanation, see this link:  

Got chopped up a bit, first two longs were scratch trades. third was a point loss, fourth just over a point gain.  Glad I wasn't around for the last 10 minutes.

Higher time frame showed some choppy signals on Friday....

Weekly showing a breakout on confirming momentum.  Daily is super-stretched, but nobody seems to care about that (Keltner channels overlaid.  One is 2.5 ATR, the other 5 ATR)

Thursday, January 24, 2013

Thu. 01_24

today's trade
A key for the above chart to define the horizontal lines and dots.  For further explanation, see this link:  

Criteria 1a on the traded time frame (15m) with long-term trend agreement (20MA > 50MA) you're looking to buy a breakout of previous highs

Higher time frame, Daily:
Stretching into upper channel, showing some profit taking into the $150 mark.  Hourly chart showing 2c-2d criteria with strong trend development, so "dips" will see buying (or covering)

So, being that the hourly is showing 2c-2d we could look for a 3d criteria setup on the faster (15-min) time frame (in the form of 3-pushes to a low, inverse head & shoulders, or seed wave)

E-mini continuous 240-min chart:
Channel still intact.  Price completing 1.5x projection of most recent momentum projection (2x comes in at 1512.75).  

Wednesday, January 23, 2013

Wed. 1_23

today's trade

Really screwed this trade up by dumping my position.  Previous two days have had very similar structure.

Higher time frame, looks like momentum is drooping a bit.

Tuesday, January 22, 2013

Tue. 01_22

today's trade
A key for the above chart to define the horizontal lines and dots.  For further explanation, see this link:  


Left a lot on the table

Higher time frame...the bull train keeps rolling
Notice in the charts below how today's 15-minute (right) 3/10 macd looks compared to the 65-minute (left) 3/10macd from Friday.  2c-2d criteria in a bull trend.

Saturday, January 19, 2013

weekly EURUSD

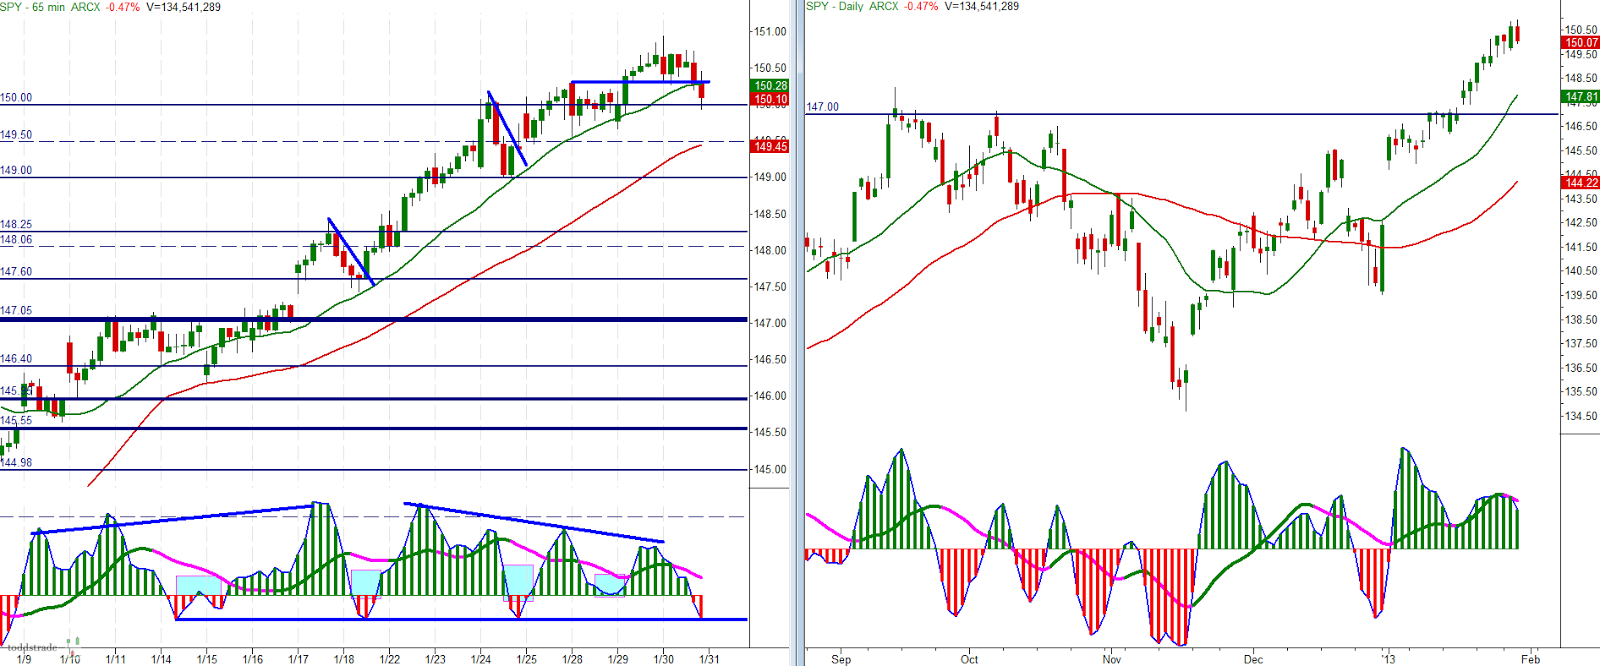
Weekly look at the EURUSD

Weekly (left) chart shows a momentum sell divergence, but that's not particularly bearish (until it is) unless we start to see some negative momentum.  Potential is that we broke out of (and so far sustained) the neckline of an inverse head and shoulders.
The daily chart (right) shows decent trend development while we are currently oscillating in the upper half of the most recent bullish momentum (shaded region).
No real clues as to what may come; we either break higher (which could see a strong move) or we break lower (which has a number of support levels to test).

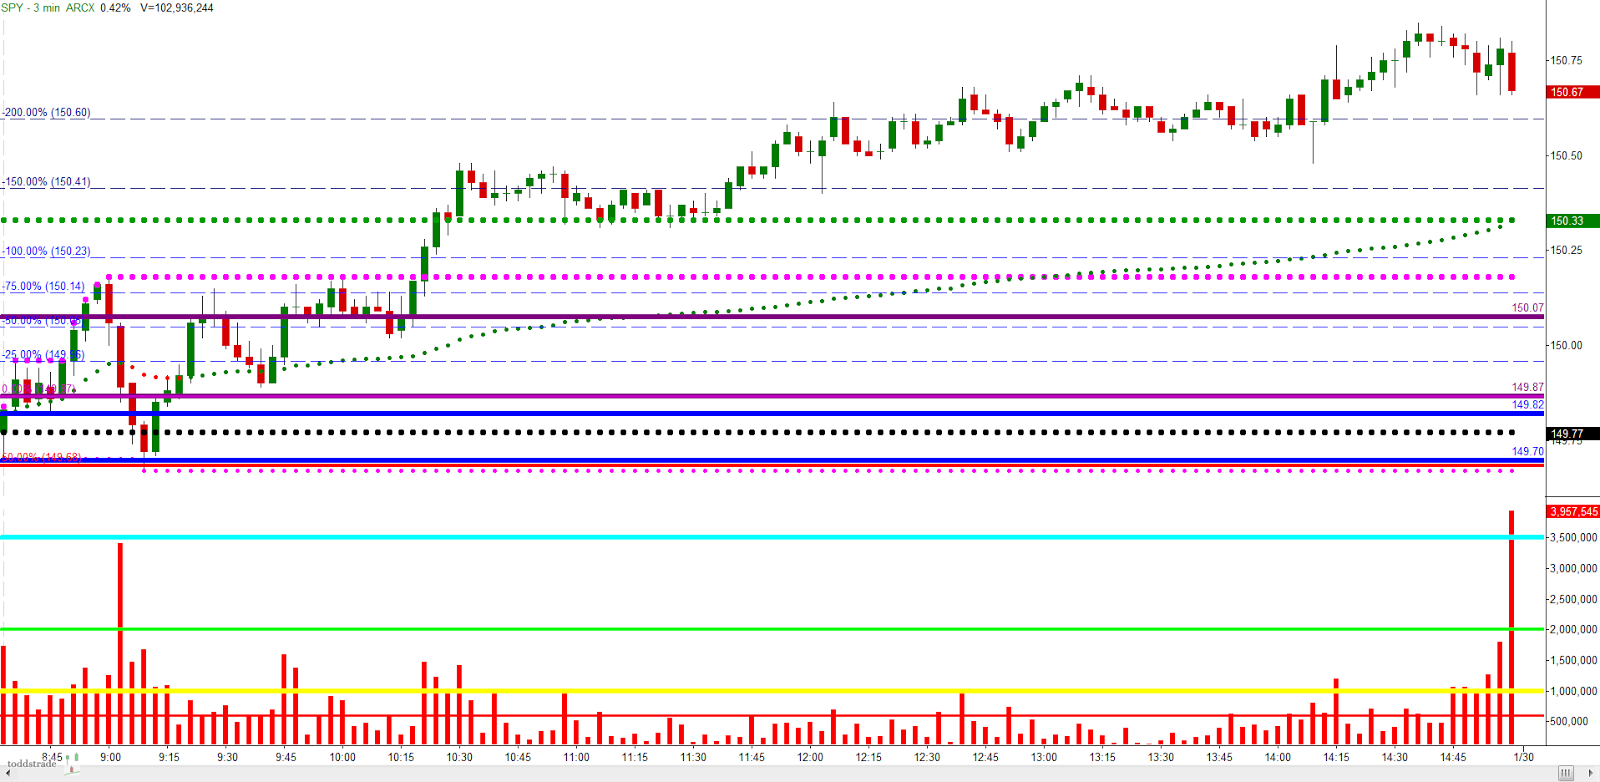
Carrying over the shaded region from the daily chart into a time frame faster gives us a closer understanding of what's occurring.  Oscillation (symmetrical cycles) within a defined range.  Below 1.325 might see panic selling (but has support into the 1.31's) while over 1.34 is breakout territory (which could see chasing/and/or short covering squeeze).  3/10macd showing 3d (on 240m chart) which could lead to a bullish move.  But the oscillation range has to play itself out.

Adding a time frame faster in the charts below;
   Price is within the 240m moving average 
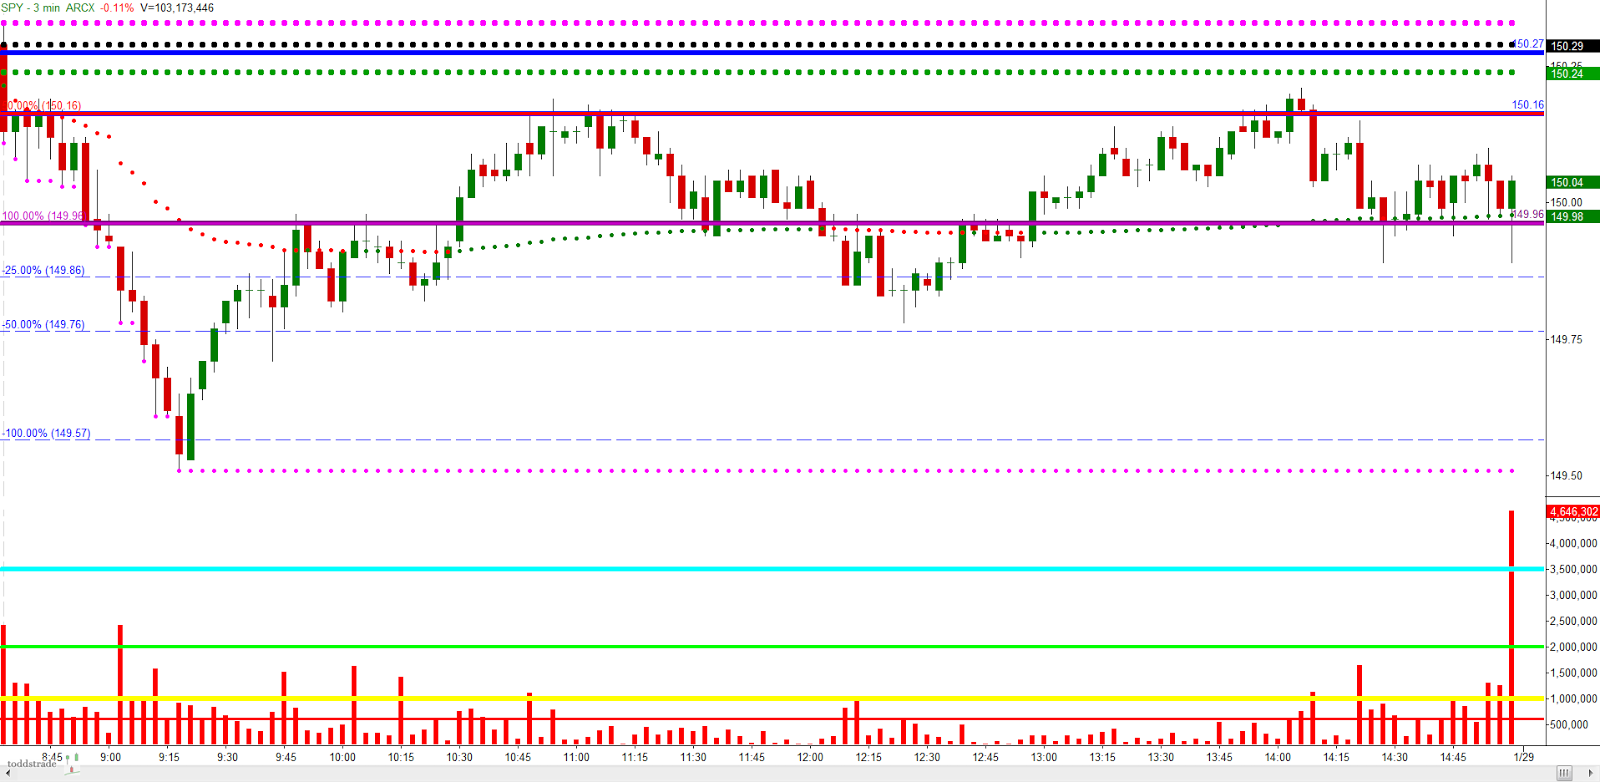
window and we wouldn't want to see it trade at these levels for much long and remain bullish.  The faster-still time frame on the right shows price under it's two moving averages with a 3/10macd showing bearishness (4c-4d).  It's on this time frame that we would like to see the 3/10macd have the fast line show an ABC wave (turn positive, pullback, then tick back up positive) before doing anything bullish.

basically....needs moar data


Friday, January 18, 2013

Fri. 01_18

today's trade:
A key for the above chart to define the horizontal lines and dots.  For further explanation, see this link:  


Blue arrows are entries, black are exits.  "X" indicative of a trade considered but not taken.

Higher time frame showing 2c-2d

Finally, the weekly.  Points worth considering:
-Corrections have become shallower since 2012.  
- Breakouts from previous highs have seen diminishing returns
- As old highs (or in this case, all-time highs) are approached it is common for positions to be thinned.  Pros don't want to buy at the highs or as price breaks out, they would prefer to buy a re-test of the breakout point.

I still believe this is an important divergence to keep in mind.  The QQQ weekly head and shoulders.  Invalidated above $67.50-$68 and the neckline coming in around $62.  If this were to break down, a measured move would be around $53 (which would still maintain the higher low structure).