The setups I include on this blog are used in conjunction with the 3/10macd and the criteria I ascribe to it as a way to alert me to an existing condition of price. The key concept to take away from this blog is that I try to anticipate what will happen on the higher time frame by using a faster time frame to trigger the trade setup. I do not trade a "system" I use two indicators to clue me in to price conditions. Please read the Disclaimer located in the sidebar of this site. I can be contacted via email at toddstrade@gmail.com
I am always open to questions, comments, or suggestions on how to improve this blog.


Showing posts with label setups. Show all posts

Sunday, February 6, 2011

Up ahead

What I'll be looking at this week:
RIMM; Broke down from a trendline before squeezing back above it.  Momentum was weak and the weekly 3/10 macd may go negative, but can reset higher if price can take out the above resistance and take out stops of higher time frames.

On the Daily, there's potential for a test of resistance higher, but what I believe was a short squeeze this week may see prices come back to support.  The 3/10 slow line just crossed zero as the fast line corrects into it (bearish) which is often a good time to anticipate a short entry and also indicative of a potential 20- & 50-day MA cross.

HES; weekly shows a rejection candle at a gap created in Oct. '08 on waning momentum.  This trend has had very little rest since Sept. '10.
Daily shows price barely holding onto it's trendline.  Volume appears to be distributive over the course of the last few weeks as price has oscillated within a roughly $7 range.  However, the trend is very much UP, so a return to support could see active buying.

MON; weekly has settled back into previous support after strong momentum.
 While the Daily shows that $74-$76 level causing resistance on a momentum divergence.  I would be ready to lean short in anticipation of the daily 3/10 macd fast line crossing the slow line.
Interesting looking at the intraday chart and volume on MON.  All gaps up have been sold on heavy volume.  It has the look (to me) of distribution at these levels getting out at an average price of $75.

FCX; I don't think this issue is done testing the highs.  The weekly showing sell divergence at the highs, but a buy (reverse) divergence at these recent swing lows.  I'm anticipating a swing up in the 3/10 macd over the next few weeks where a higher prices may result in another sell divergence.
The Daily shows price resting on its 20- & 50-day MAs however there's also a sell divergence present (higher high in momentum, lower high in price; indicative of a short squeeze).  So initially I would like to see selling back to the recent lows, or even better, beyond the lows where a buy divergence would set up.  Otherwise, if it goes too far too fast it could exhaust itself over $60.

NVDA; Watching for a potential blow-off move to trade.  The weekly is starting to show a divergence (higher highs as the macd ticks lower highs).
While the Daily shows this ascending wedge, on waning momentum.  So, I may look to get long, but quick to exit and/or reverse.
 
OXY; Keeping an eye on this as it consolidates (flags) under all-time highs.  The 3/10 macd looks to be setting up for another bullish push higher.
The Daily looks like it could come back to the 50-day as the macd fast line pulls into the slow line, but I think that may be a buyable pullback.

CMI; Working on a steeper trendline where price looked to be breaking down from, but quickly recovered.  The macd shows a reverse divergence where a test of the highs seems likely.
The Daily shows strong volume on the recent divergence and overhead trendline base building.  A slight pullback would be nice to see.

Sunday, January 23, 2011

week ahead

A breakdown of some stocks to watch in the week ahead.
MCD: - earnings report on Monday
weekly: Momentum indicator ticked lower while prices went higher (short covering).  Also, the indicator is showing a reverse divergence; Higher low in price, lower low in momentum. This down channel is pretty tight and steep, and easy to break out from.
The daily showed solid covering/buying at the 200-day MA.  Mild resistance overhead, including the 50-day MA.  Should prices sell off on earnings and return to the $70 area we could see a buyable momentum divergence.

OXY - earnings on Wednesday.  No one's selling and price sits at the highs.  However, good earnings do not equate to higher prices.  OXY in particular has seen 11-weeks of 18+% price increase with very little price discovery in between
The daily certainly looks ready to break out, so it's a matter of conviction follow-through we have to gauge


Some observations I find interesting:
The QQQQ has a reverse divergence (so long as it doesn't take out $54)

FCX reverse divergence as well

APA-weekly gap fill overhead
Just my personal opinion, but I feel any move above this rectangle on the daily as it approaches $130 could make a good daytrade short
Chugging right along is the OIH where it is approaching this Oct '08 gap.  These resistance levels are a process, so we can either expect immediate rejection and testing lower, or basing behavior that builds value at this level over a number of weeks/months.

The trend here is solidly up.  The 3/10 MACD slow line has been bullish since September, while each momentum thrust up has been impressively strong.  One potential downside observation would be that the 3/10 slow line is working it's way closer to the zero-line. 


Tuesday, December 14, 2010

GOOG

Interesting development in GOOG lately.  Price has closed under the daily Open for the past 7-days straight, all while closing higher than the previous day!?   Seemingly drifting along the midline of this pitchfork.


Over the past two months GOOG has retraced as much as the 61.8% mark, and sits above it's 50%.  There's a lot of clear air above and below price right now.

Should price explore lower from here after recently failing this steep trend line, the first stop-trigger level may be around the $585 mark.  I'm looking towards that $578 mark:

Saturday, December 11, 2010

Healthcare sector lit up

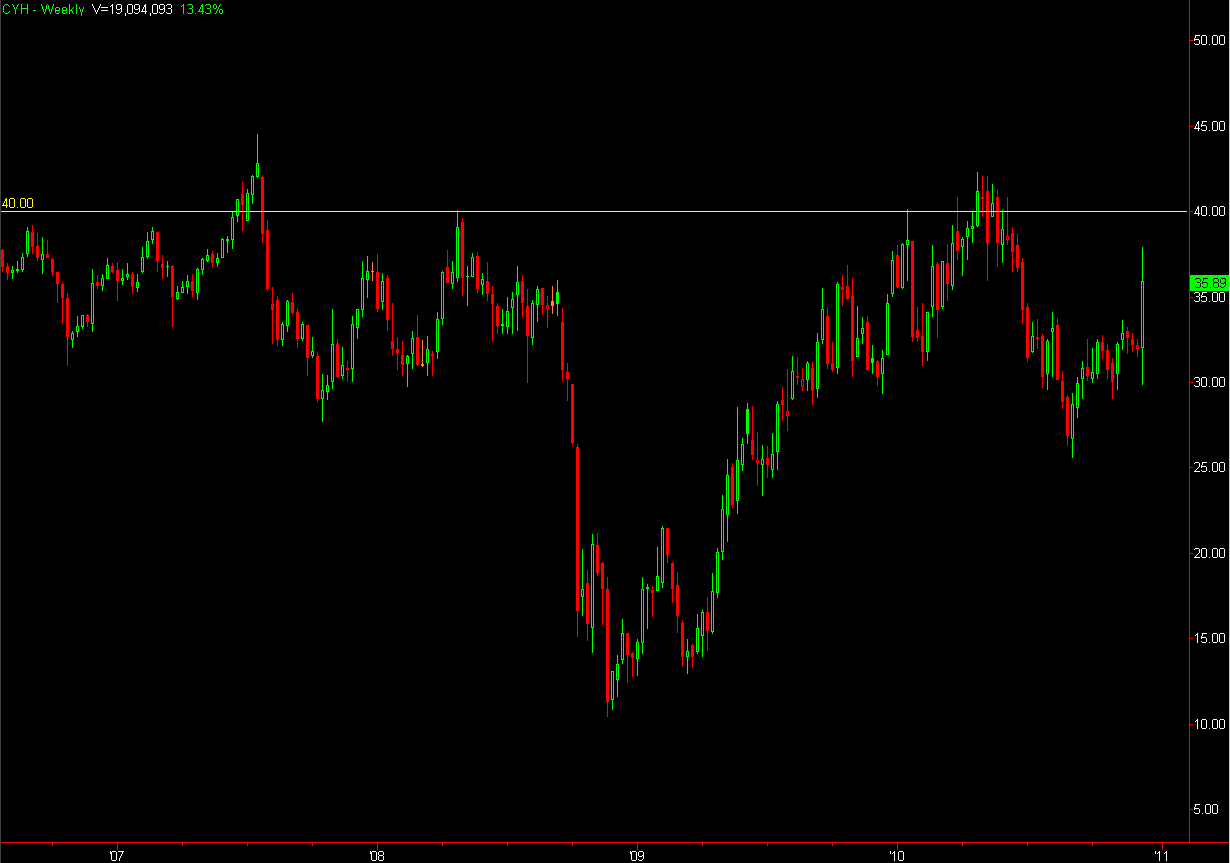
CYH's bid for THC brought some attention to the XLV this past week.
Currently XLV is down 1.5% for 2010 (the most lagging of the 10 most tracked sectors, followed by Utilities, XLU and Financials, XLF).

weekly charts showing all sorts of inverted H&S patterns with an overhead neckline:
XLV -Could have a breakout move in the week ahead

CYH, of course that big move all happened in one day though-


THC again, a one-move wonder on Friday-


While other components of the XLY show some promise.
A lot of clear air above for UNH


MRK - broke out from this W-bottom pattern and looks to try to regain $36.50 support

AMGN - formed a hook (seed wave) with what looks like a breakout candle on Friday

PFE is interesting.  This weekly chart shows a large amount of volume over these past two years.  While price recently broke out of and re-tested this LONG-standing down trend line

Sunday, November 28, 2010

overnight

EURUSD and @ES having the same setup overnight

EURUSD - a lot of buying tails at a previous swing low


@ES - holding a higher at 1184

Friday, November 26, 2010

setting up

GLD - Head & Shoulders is going through the motions and looking weak


FCX - Head & Shoulders pattern

SPY- this funky triangle will likely resolve itself next weak.  It can even be argued that this is a Head & Shoulders pattern with a week left shoulder.

AAPL - Head & Shoulders pattern.  Price has tested the $300 mark 3-times already on successively waning momentum

When you start seeing a lot of issues with the same pattern (Head & Shoulders tops in this case) it should be raising some cautionary flags. 

With the $Dollar pushing through resistance, next week should make for some interesting developments

Friday, August 27, 2010

Momentum Buy Divergence

Signaled across the board today, was a momentum buy divergence on the 3/10 oscillator (daily chart). A handy dandy indicator to use when price is cycling, as it is now (as opposed to trending, and has been ever since the flash-crash).
DIA (green vertical lines indicate the divergence buy signal. Red vertical line represents a divergence sell signal),
SPY
QQQQIWM - Actually triggered yesterday and again on Tuesday.SMHIYT
The biggest problem at this point is the overhead resistance (a.k.a. SUPPLY). One can't expect a "Death Cross" to mean an immediate rejection of price. There are bound to be some short-covering, dip-buying rallies.Essentially, what it all boils down to is that the coming bounce should determine whether we probe lower (for a lot of, so far, untested price levels below), or higher (within the range we currently find ourselves in, up to around $113). It is critical, because "pace" (the bounces off of support we have experienced) is quickly fading.
Just as an aside, here's a good example of why the 3/10 oscillator isn't ideal in a trending market. Unless of course you use the signals as a contrary indicator.
CF