The setups I include on this blog are used in conjunction with the 3/10macd and the criteria I ascribe to it as a way to alert me to an existing condition of price. The key concept to take away from this blog is that I try to anticipate what will happen on the higher time frame by using a faster time frame to trigger the trade setup. I do not trade a "system" I use two indicators to clue me in to price conditions. Please read the Disclaimer located in the sidebar of this site. I can be contacted via email at toddstrade@gmail.com
I am always open to questions, comments, or suggestions on how to improve this blog.


Thursday, April 26, 2012

QQQ reversal

QQQ island reversal looks like it is playing out well

Worth noting the 3d setup going into the close on Tuesday

gold

Chart worth watching for a breakout of the overhead trend line, which seems to have turned into the neckline of an inverse Head & Shoulders pattern

range

This range of ours in the ES

Wednesday, April 25, 2012

Similarities, then and now

I have posted before the similarities that exist in the current market environment with those going back to late 2010 - early 2011.
Here is the SPY going back to 2010 where we had a narrow channel, leading to a "W" pattern correction, resulting in measured move and nearly identical narrow price channel.

Here is the current environment where we have seen the similar narrow price channel which we have recently corrected out of and what looks like a "W" corrective pattern

Saturday, April 21, 2012

week ending 4_20

The three most interesting charts to me coming into the last two weeks of April are Gold, Treasuries & the U.S. Dollar Index.
Treasuries (in this case the TLT) have yet to sell off below the $100 mark despite the vapor rise in equities this year.  This weekly chart (left) simply looks like a pullback in a bullish trend:

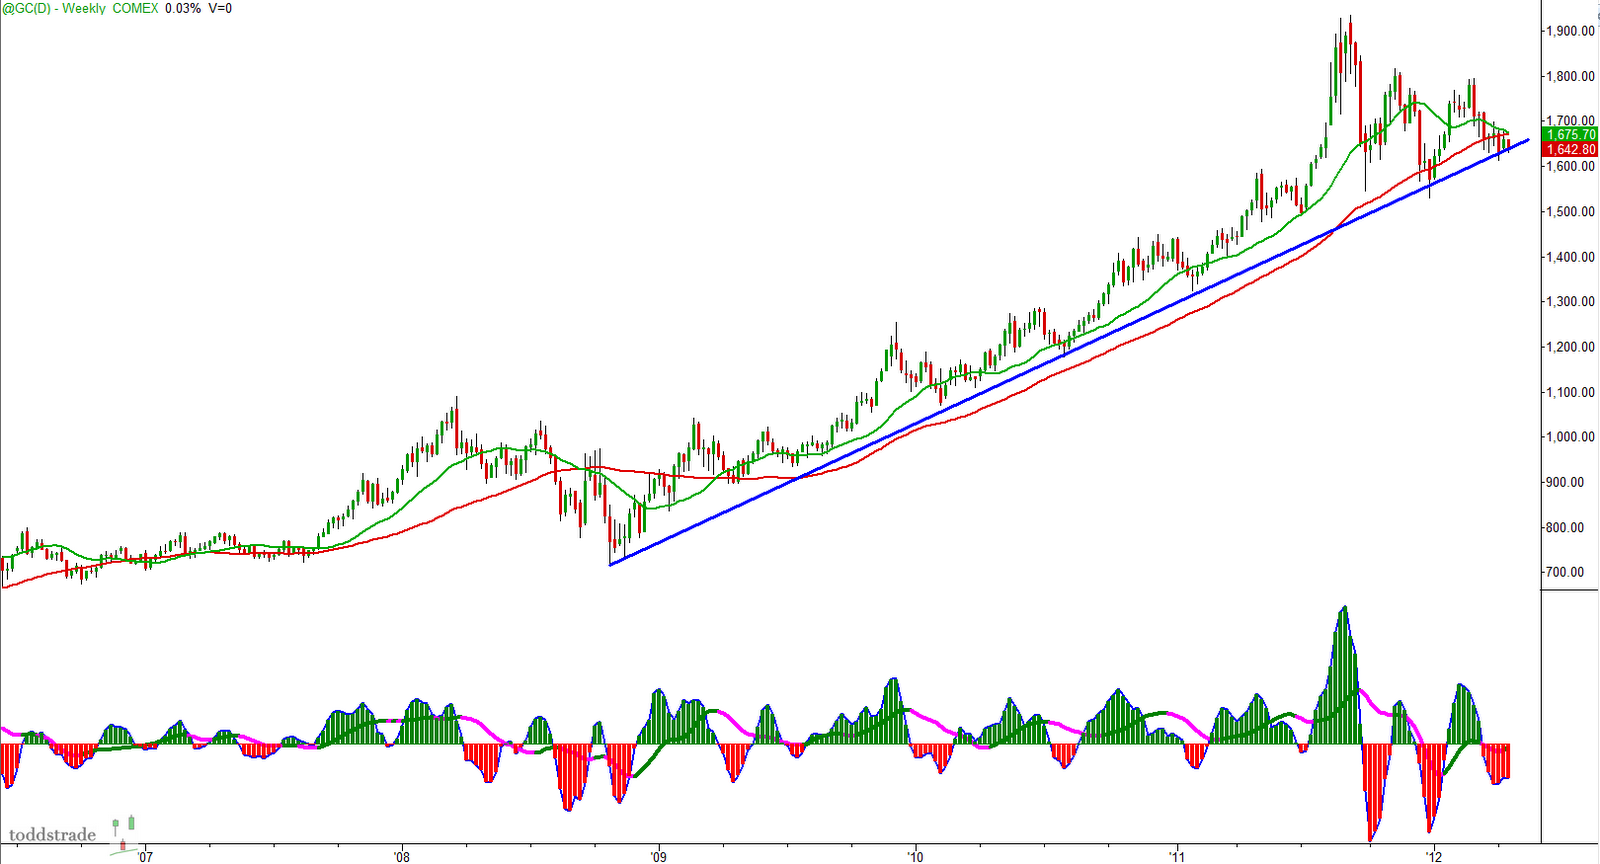
Gold - The weekly is testing this long-standing trend line and a breakdown (under, say, $1620) could force a much larger correction.

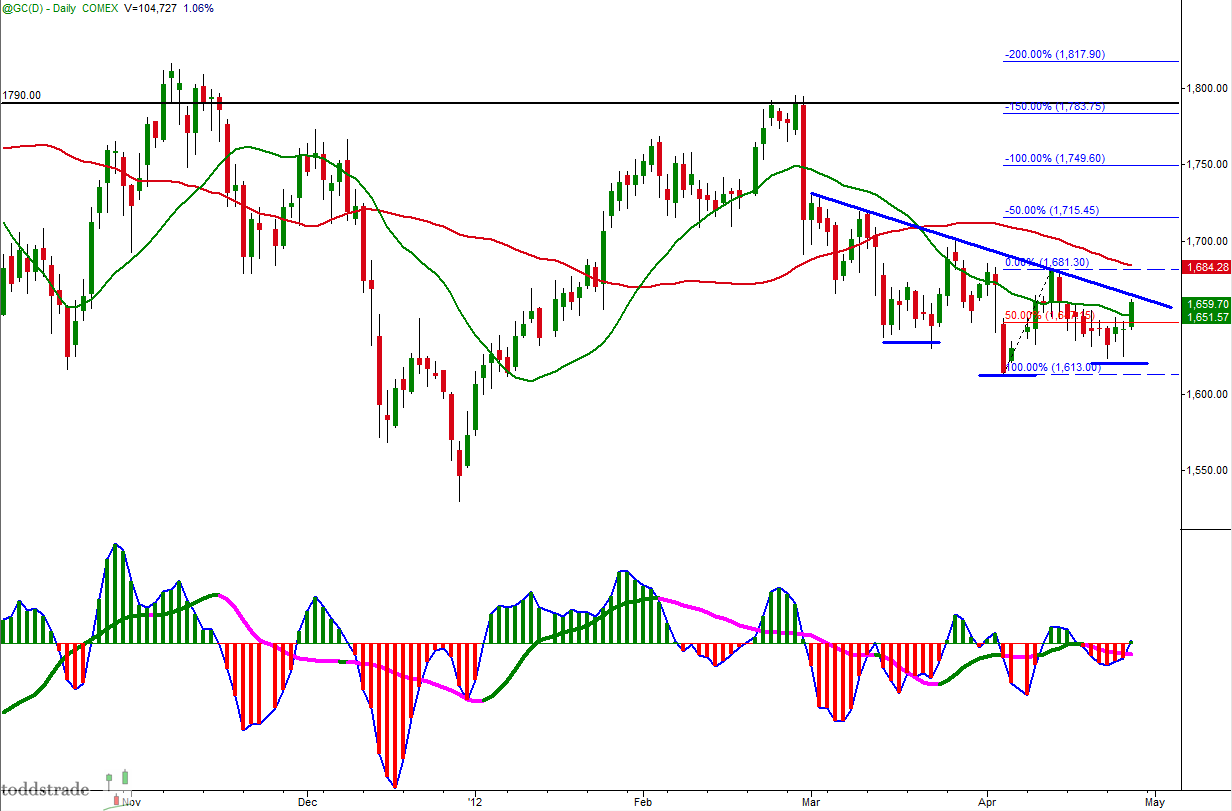
The Inverse Head & Shoulders on the daily (below, right) is still valid, but further downside will begin to erode that premise.

The U.S. Dollar Index had a week of mostly selling (equities & dollar selling this week?) but the weekly trend line is still intact (though there is a 2b short setup on the 3/10macd).  If price breaks down there is a chance this weekly chart (below, left) forms an inverse Head & Shoulders (indicated by the empty ellipse)

What looked like a Head & Shoulders pattern on the EURUSD daily ended up holding the neckline this week and squeeze higher.  There is a potential 3d setup on the weekly (below, left) with a seed wave that has held the 50% retracement on multiple tests, so watch for a breakout of the wedge that has formed on the Daily:

Crude Oil may have formed an inverse Head & Shoulders on the Daily (below, right) and is possibly setting up the 3d setup (which you will see when the higher time frame is setting up the 2d criteria), definitely watch for a break out from the daily channel

Copper - had a strong day on Friday as it held this confluence of Fib. retracement at support, a retest of the previous breakdown point looks in order.


Thursday, April 19, 2012

Tuesday, April 17, 2012

Tues. 4_17

Many issues set up the 3d criteria into the close yesterday and followed through today.
SPY - though this is not the 3d criteria, it is very similar in character (technically a 1d and first cross entry), the best of these 3d setups on the open are those that gap above the previous resistance zone.


While here is one which succeeded in overcoming the first boundary of resistance, but couldn't get past the second level.

AMZN - got stopped out on this one for a loss, though it did what I was anticipating (went higher)

AAPL - was a great example of the 3d, which is the bear trap short squeeze.

Monday, April 16, 2012

Mon. 4_15

Some setups from today.
Midday:
 NSC - Relative strength with a bull flag at previous day's resistance.  I missed the 1st up-arrow entry and entering up against the 50% projection (of the smaller seed wave) and so near the IB-high was a "short leash" trade.
Here is how it looked on a 3-time frame perspective.

NFLX - Seeing 3-pushes to a low on the 15-min and a small double-bottom on the 5-min at the IB-low the entry was long with a target of prior breakdown points that coincided with the 50% & 100% projections.  Got out too soon before price tagged the 100% projection

AMZN - into the close trade which didn't amount to much

I didn't take this SPY trade, but it fits a number of trading rule categories.
On Friday we broke down from a momentum bear flag and continued on that path today.  Price found support at the 50% projection (as well as various other technical price points) of that bear flag on a momentum buy divergence (15-min chart) with 3-pushes to a low (illustrated on the 5-min chart).  The 3-pushes formed an inverse H&S (or seed wave) and achieved the 50% projection, overshooting to tag the morning's breakdown point at $137.68.

Saturday, April 14, 2012

week ending 4_13

Starting with the U.S.Dollar which held its weekly trend line while the daily has a rounding bottom/inverse Head & Shoulders look intact.

With the EURUSD weekly trend line holding resistance and the daily H&S closing the week right at its neckline

Copper fell apart this week, failing a number of supports.  Notice how the weekly 50-MA is trending down while the 20-MA is correcting into it....
...this then gives way to this longer-term perspective picture

Gold still fighting with $1680 overhead

The S&P500 weekly chart still has the stench of a trend line throw-back.  Third time's the charm?  Realistically, the COMPX could lose 300-points, the S&P500 could lose 100-points and the Dow could lose 1000-points and all would still be in decent technical shape.

Crude Oil still vacillates within this daily channel.  The weekly has a roll-over look to it.

Curious how beaten-up the energy sector has been.  The weekly showing the three lower highs with the 50-MA turning down and the 20-MA correcting into it, while the daily channel looks like it needs a final flush with such a tight down-sloping channel.

Next week will be interesting.

Friday, April 13, 2012

3d roll-over

A good example of a failed 3d setup, which often-times brings about a trade-able position on the short side.

Fri. 4_13

Two trade setups from yesterday and today.
SPY 3d going into the close Wednesday that followed-through on Thursday morning.

The faster time frame of this pair triggered late (by the time it triggered price was at the 50% projection already), so for a quicker entry you can go to a faster time frame.  In this case, if you were still waiting for a trigger entry, you didn't get it until about $138.02 which was fine, so long as you stick to your target objectives.  In this case the 50% projection target was $138.34, or $0.32 per share for half of the position:


Today in BIDU
2d setup.  Reverse Divergence on the higher time frame, inverse H&S on the faster time frame.  Instead of taking the final half off at the 100% projection I let it interact with the IB-high to see what it would do into the close and let a faster time frame show signs of waning momentum


Tuesday, April 10, 2012

Some Charts

Copper - A mess.  After the failed breakout from its wedge Copper turned and ended up breaking through its trend line.  Currently sitting at some support but upside will be a battle.

Crude Oil - Has a slight bullish divergence while at the lower end of this channel

TLT - Didn't break down the way most were thinking it would over the past few weeks.  Turns out this weekly chart was just a pullback of the trend while the daily gave a 3d setup.

The U.S. Dollar Index- Held the trend line and has the look of an inverse Head & Shoulders

GLD - another inverse Head & Shoulder potential, though it has a long way to go until it tests the neckline

Tues 4_10

Finally, some selling to relieve some of the overbought conditions.
The SPY is registering strong downside momentum while price is still above the previous swing low pivot, but we can't say for sure it is a reverse divergence until price proves to hold above the $134.60 range.

One issue of concern would be the proximity of the slow line to zero.  The slow line crossing zero typically precedes a 20- & 50-MA cross, however, these two MA's do have a decent distance between each other.

Back to 2011 we saw these two moving averages trending much like they are now and it took 4 instances of the slow line crossing zero before a steep sell-off occurred.  The first instance was just a pullback of the trend, but the second and third were momentum events that wore down the trend and the fourth instance was the textbook lower high trend change.

To better visualize the the trend change take a look at a chart with just the moving averages and price removed, notice how the 50-MA flattens out then starts moving lower while the 20-MA corrects into the 50-MA forming the lower high (while on the flip side the reverse happened to start our most recent bullish cycle).  So until we see something like this develop I would suggest we're at least months away from a character change if it were to occur.  


Friday, April 6, 2012

NFP upset

The ES (here with GLOBEX session) fully broke down from its Head & Shoulders pattern this morning following the NFP report.  This morning's move fulfilled a 50% projection of the previous momentum, while a 100% projection move would roughly coincide with the H&S measured move.

Thursday, April 5, 2012

Thurs. 4_5

The SPY ended the week in a position where anything can happen.  We're at the lower end of a channel where we either break down or test higher.


Drilling down further there seems to be potential bullish hope in the form of a 3d setup.  So, come Monday watching for strength through $140.20 for a potential gap fill overhead (gap fill would coincide with 100% projection of current seed wave).