HG
The setups I include on this blog are used in conjunction with the 3/10macd and the criteria I ascribe to it as a way to alert me to an existing condition of price. The key concept to take away from this blog is that I try to anticipate what will happen on the higher time frame by using a faster time frame to trigger the trade setup. I do not trade a "system" I use two indicators to clue me in to price conditions. Please read the Disclaimer located in the sidebar of this site. I can be contacted via email at toddstrade@gmail.com
I am always open to questions, comments, or suggestions on how to improve this blog.
Tuesday, June 30, 2015
Saturday, June 27, 2015
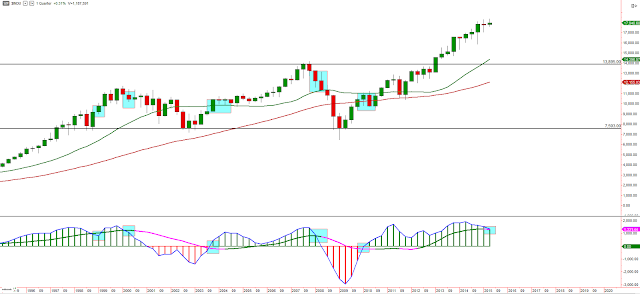
DJIA Quarterly
LONG-term chart. Dow Jones Industrial Average Quarterly time frame showing a 3/10macd fast line potentially crossing the slow line (bar ends at the end of the month). Not something that happens very often in such a slow time frame. The overall trend would remain bullish for quite some time but it is interesting that the 20-period MA lines up nicely with support.
not much has changed
In terms of the current (weekly) inverted cycle. 398-weeks off the lows into the most recent all-time high.
Thursday, June 18, 2015
hooking
look, I realize that I'm flip-flopping on my intrpretation of the higher time frame Gold futures. You can get chopped to pieces in narrow range consolidation, but eventually price will break out in one or another direction, and that's where you need to act. So, until price breaks out we have to look for clues.
Price may be hooking up, which would turn the higher time frame (monthly) 3d critieria back to bullish. Price has coiled for nearly one year, expect a big move and follow the direction of that move.
Price may be hooking up, which would turn the higher time frame (monthly) 3d critieria back to bullish. Price has coiled for nearly one year, expect a big move and follow the direction of that move.
Monday, June 1, 2015
Subscribe to:
Posts (Atom)


