The setups I include on this blog are used in conjunction with the 3/10macd and the criteria I ascribe to it as a way to alert me to an existing condition of price. The key concept to take away from this blog is that I try to anticipate what will happen on the higher time frame by using a faster time frame to trigger the trade setup. I do not trade a "system" I use two indicators to clue me in to price conditions. Please read the Disclaimer located in the sidebar of this site. I can be contacted via email at toddstrade@gmail.com
I am always open to questions, comments, or suggestions on how to improve this blog.


Tuesday, March 29, 2011

CDE: Buy div. on the open.  Target PDL and prev. day's breakdown point
GS: similar setup as previous
MEE: 3d criteria setup on a pennant breakout.
RVBD: momentum buy divergence on a 3d setup:

Monday, March 28, 2011

shorts mostly

FCX
  Reverse divergence short (higher time frame failed pennant breakout) on the bearish engulfing candle (6th bar) on the 15-min bar.  Cover on the momentum div.   Short again on the 2d criteria setup cover end of day

GS inverted cup w. handle breakdown corresponding with a 4d short setup.

JCP long based on a 3d setup.  With this much weakness my initial target for half was the PDL, while the other half was stopped out at b/e.  Always look to reverse when the 3d pattern fails.
AMZN ascending triangle breakout (3a long entry) turned fakeout.  Was a nice bear flag pattern into the close but I didn't revisit

78.6%

78.6% retrace so far in SPY on a reverse divergence

Friday, March 25, 2011

divergences

A number of examples of a Reverse Divergence set up on Thursday.
FCX: Momentum registered its lowest reading since last week on a higher low, leading to a snap-back rally, while the re-test of the highs fizzled out, printing another divergence (lower high in price with an equal to slightly higher momentum reading).

RVBD: Reverse divergence on Thursdays lows and highs.  The long entry off the reverse divergence worked, but the sell signal didn't work out.
MON: The opening high was a sell divergence which turned out being a stubborn short.  Meanwhile the lows of the day was a buy divergence based on a strong momentum reading lower on a higher overall low.

MEE: Lower momentum lows on higher price lows, while on the 5-min a buy divergence triggered a long back to the Open of the day.  The Cup w. handle measured move was reached the following day.
CNX: More of the same reverse divergence, arrows indicating trigger entries
CDE: One which didn't work.  But the fact that it didn't work should be considered a hint at weakness going forward

Wednesday, March 23, 2011

setups today

A lot of opportunity today, but I only benefited slightly.

RVBD had a 3d setup going into the previous day's close, so I was looking for a potential dip buy on the open.  I got chopped up on the first entry for a small gain, better results on the 2nd & 3rd trades, but why I didn't just hold on from the 1st or 2nd entry I don't know

LVS long, again based on the 3d criteria.  I actually had two trades here, one later in the day not marked that I got from 38.80 to 39.

CAT long, again, two trades.  I don't know why I couldn't just hold it, but I keep tight stops, so things like the end of the day here on CAT don't catch me off guard.


Adding an example of the opposite of the 3d setup, which is the 2b short setup.  LVS showed good examples of them both these past two days.  As an aside, it's important that the slow line shows a smooth trend and is approaching the zero line.

Monday, March 21, 2011

missed opportunity

Some setups I saw today but didn't take and one that I did.
RVBD 3d setup, long on an opening range breakout

RIMM; nothing stellar, but it worked, 3a criteria on the 15-min chart waiting for a pullback on the 5-min chart which coincided with an ascending triangle breakout.

PAY, 3d setup ascending triangle. nice how breakout resistance turned support.
X, I actually took this trade but hesitated for 10-minutes.  It was another 3d entry but the entry candle should have been two bars earlier (on the 5-min chart) but I didn't trust it.  Exited at $53.90 because of longer-term resistance at the $54 whole number.

Saturday, March 19, 2011

Trade setups week of 3/14

What needs to be explained about how I see trades is that I use the 3/10 macd as my seeing eye dog, which just helps me to pick up on the stability and direction of the short-term trend I'm attempting to trade.  Essentially it's just a tool that helps me to pick out mostly lower highs to enter short or higher lows to go long.  Something else that has helped me was to categorize where price is in the short-term trend by determining the 3/10macd criteria that is present at that time.  I wrote a blog post that introduces the concept here and laid out a spreadsheet regarding it here.
  The concept is simple; price follows a path of least resistance, and as such will often continue in the direction of the established trend (regardless of time frame).  So, you just need some context and a way to define trend for your objectives.  I use the 3/10 macd as a way to anticipate what price may do based on the pre-determined "trend".   So what I see on the 15-min 3/10 macd is a criteria (from the above linked spreadsheet) which matches a good probability setup.

Monday morning CSX short based on the 2c criteria and looking for a shortable pullback on the 5-min.
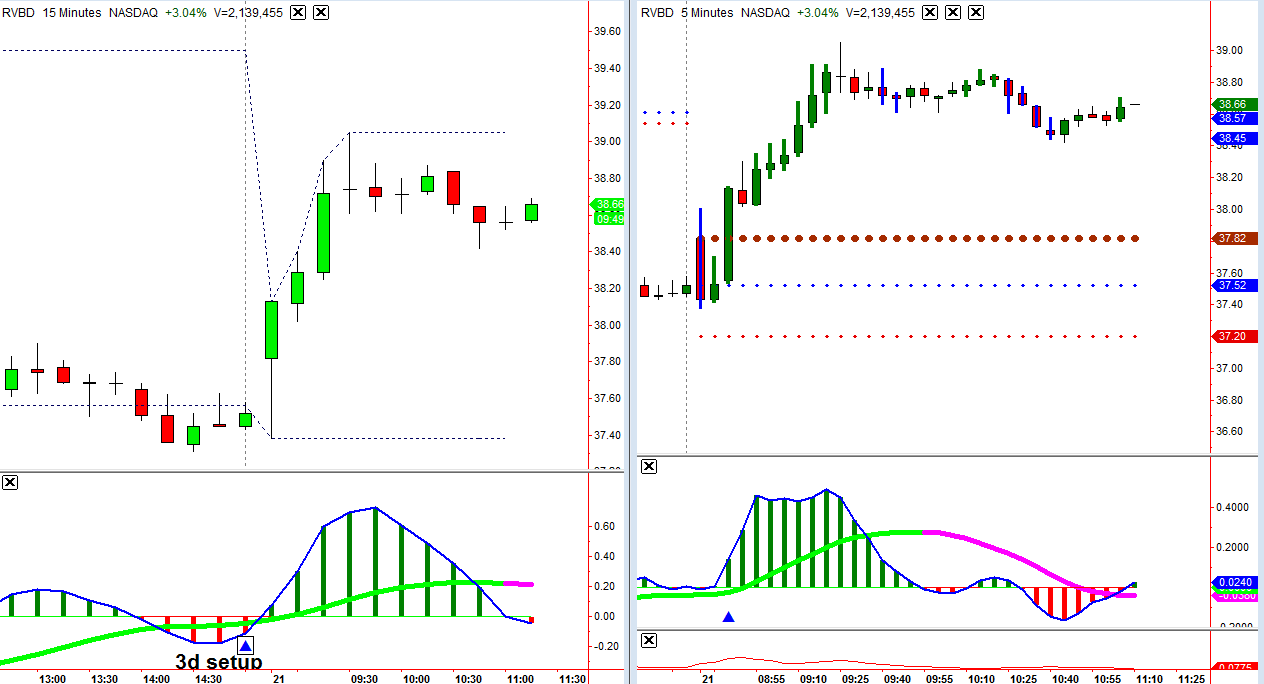
Later that day a long entry was taken based on the 3d criteria (highlighted on the 15-min chart in a rectangle):

Here was another 3d entry in ADM where the target was simply the PDL.  I have found that 3d setups typically occur as a short-covering phenomenon later in the afternoon which can run into the following morning, but it is critical to know where realistic resistance is and whether price is increasing to test resistance or if it has broken out of it (leading to more short-covering).

A 3a setup often provides good long entry opportunity, buy pullbacks on the 5-min:


A 1a setup can also provide good long entry opportunity.  Looking to buy a pullback with help from the 5-min 3/10 macd to anticipate that pullback:


Another 1a:

This one had great opportunity but lousy execution and I missed the re-entry :(

2c short in the SPY
4d short, was simply entering in a pullback of previous momentum

Friday, March 18, 2011

Going Forward

  I have been mentally masticating this post for quite some time.  Essentially, what direction to take this blog-O-mine (do I even want to continue keeping a blog at all?).  I think it's safe to say that my lack of posts have thinned out my readership in such a way that I can practically consider this my own private blog now anyway.  So, I'll just play it by ear.
  What I have decided was to just post whatever the heck I want to post.  I don't know why, but I began to think I needed to live up to expectations on this blog (a self-induced guilt?).  I'm not getting paid to keep this blog, people aren't paying me to perform a service on this blog, so I'll just make it what I make it and if people don't appreciate then they won't bother reading it, which is just fine with me.
  I'll admit, until recently I never truly felt that I had a stable approach to my trading.  Rather, I would leapfrog from strategy to strategy, from setup to setup, and mostly play it by ear, deceiving myself that I had a stable approach.  There's nothing necessarily wrong with that (so long as you're not losing too much money) in the sense that it's a process most people go through before they find their particular fit.  I have spent a long, difficult time ironing out my approach to trading and am actually beginning to feel a sense of comfort settling over me.   All traders should have a detailed business plan outlining how they intend to trade, however, it takes time and a lot of trial and error before this playbook is actually reflective of the individual's personality.   I entertained the idea of sharing my entire plan/trading outline, but everyone needs to create their own reality within the trading matrix.  I may write briefly about the setup I took, but I'll probably just post charts of trades taken. 
So, what I envision from this point on is to just follow my plan and document it on this blog in the process.  I'll put up some charts over the weekend to start things off.


Tuesday, March 15, 2011

updated pitchfork

SPY monthly with a confluence of two long-term paths:

Off of the '09 lows and up to the most pronounced swing high/low (price has failed to touch the mid-line, which Andrews theory would say makes price susceptible for a test of the lower trigger (white) line).

Keeping the purple longer term pitchfork and adding the intermediate yellow based off of the seed wave which this rally sprung from (also included is a sliding parallel)

Wednesday, March 2, 2011