The setups I include on this blog are used in conjunction with the 3/10macd and the criteria I ascribe to it as a way to alert me to an existing condition of price. The key concept to take away from this blog is that I try to anticipate what will happen on the higher time frame by using a faster time frame to trigger the trade setup. I do not trade a "system" I use two indicators to clue me in to price conditions. Please read the Disclaimer located in the sidebar of this site. I can be contacted via email at toddstrade@gmail.com
I am always open to questions, comments, or suggestions on how to improve this blog.


Wednesday, May 30, 2012

Wed 5_30

Two setups in the SPY.  The first I traded, the second I missed.
The first setup was in anticipation of 3a criteria (price moving higher to test resistance (inverse H&S on 5min)

The second setup was anticipation of the continued bearish sentiment after resistance was rejected.  Two potential entries but the seed wave Fib. projections are based off of the second entry

Tuesday, May 29, 2012

Dollar Index pitchfork

Weekly chart with Andrews pitchfork and sliding parallels.  The Dollar index looks as though it is on a trajectory to test that first sliding parallel line:

SPY 2d

-Bullish trend in place (20- & 50-MA slope & distance) and price above MA's.
-Pull back into a support area (in this case the previous day's high) which often registers as a reverse divergence.
-Double bottom into the later afternoon (can otherwise be an inverse H&S or 3-push to a low).
-Price returns back to the breakdown point (continues in the direction of the trend).
I use the term "2d setup" to define the above list of criteria, as mentioned in previous posts.  So here is what it looked like in the SPY today; as an aside, had price rolled over under $133 (around the 1:30-2:00 hour) this could have been a potential short:


And so price is in the reversion to a mean phase, in this case the 20-day MA, which coincides with the 38.2% retracement.  (Pay no attention to the lower wick on the chart below, it appears I have to clear my cache).

Friday, May 25, 2012

overnight range

  If you follow any market with active overnight/pre-market trading this is probably elementary to you, but I thought I would highlight the significance for those that may not be aware.  Knowing where the market traded before Regular Trading Hours (RTH) begin is incredibly useful in framing the context of where price is, or where it may want to go (after all, it is an auction process that tests back and forth to gauge interest in higher/lower prices).
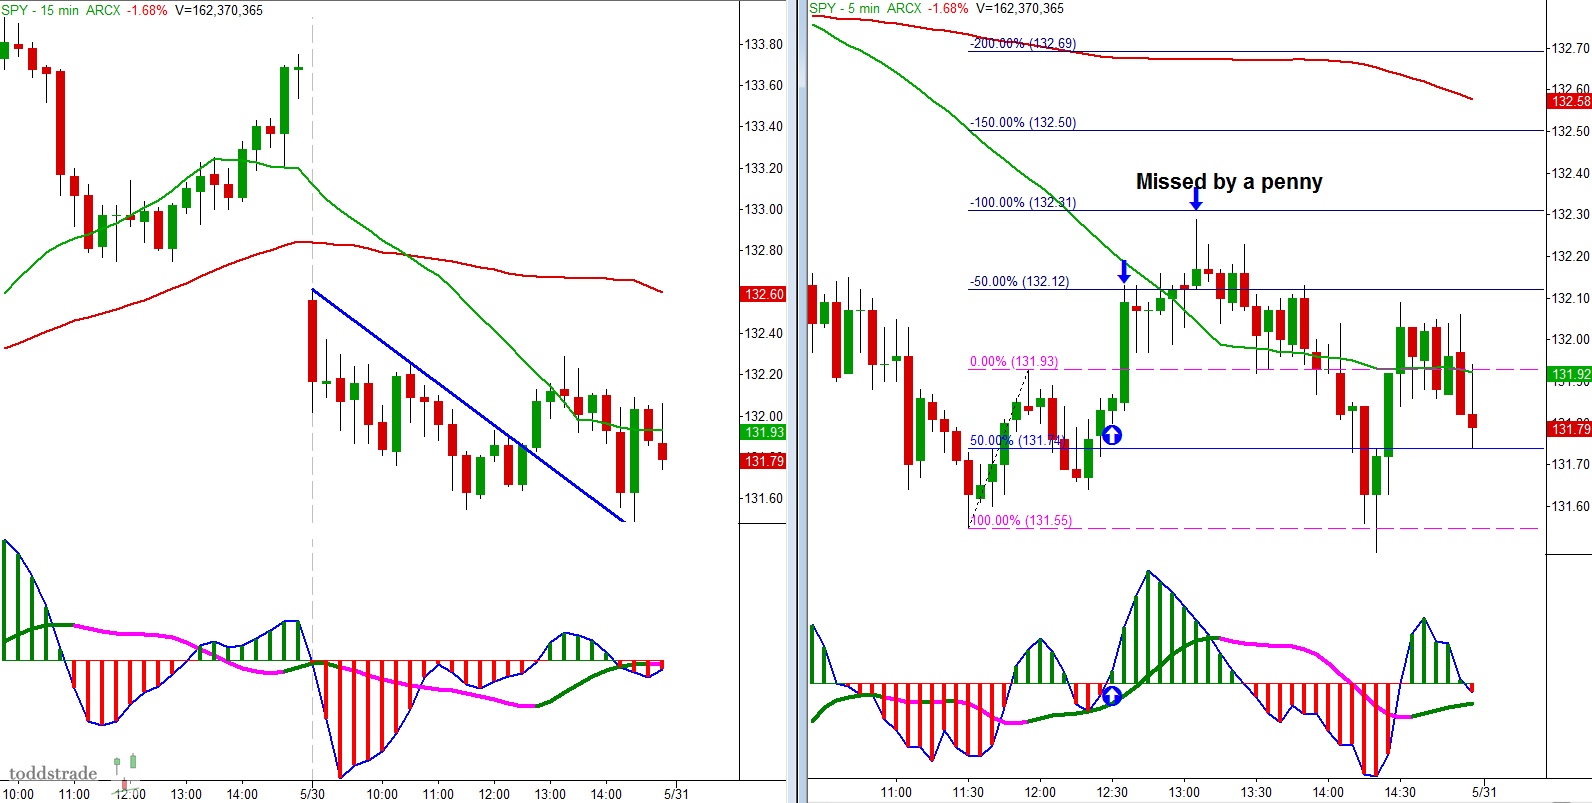
  So, before the market opens at 9:30a.m. EST (8:30 CST my time) I frame the highs and lows of the pre-market in the SPY.  These levels are indicated by purple horizontal lines in the charts that follow (where p/m_H refers to pre-market Highs and p/m_L refers to pre-market Lows).  The vertical blue dash line indicates the open of RTH.  In the chart below we can see how closely this compares with the futures globex market on the right (the E-mini S&P in this example):


Along with the p/m_H & p/m_L I like to extend Fibonacci projections off these levels in 50% increments.  So, starting with trade from Monday May 21 here we have the SPY with pre-market included.
Monday was a trend day up, but notice how price behaved at both the p/m_L & p/m_H before breaking out:

Tuesday May 22nd; a test higher (just beyond a 50% projection of the overnight range) and a test lower (nearly to the penny of a 50% projection) before settling back around the previous day's close

Wednesday May 23rd; A narrower overnight range where on the open the p/_H was rejected and price moved swiftly lower to a 100% projection of the overnight range.  Eventually however, price rallied higher, extending to the 100% projection on the upside (notice how it gets caught up on the p/m_L, needing to pull back before it can take off).

Thursday May 24:  A very wide o/n range and being a range-bound market in this instance, price tests both extremes:

Friday May 25; A quiet pre-holiday environment where price based along the p/m_L for most of the afternoon before breaking lower and reversing on the 50% projection.

Anyway, to get an idea of where you're going it helps to know where you've been.

Thursday, May 24, 2012

SPY retrace

The SPY held a 50% retrace of the most recent momentum.  While spending most of the day pulling back and consolidating, price extended higher into the close.
  The 5-min chart includes the after-market (indicated by blue dash vertical line) to show the follow-through.

Wednesday, May 23, 2012

Wed. 5_23

Just a quick chart update on Crude and Copper being that I haven't posted a chart of either in a while.
Both below their 200-day Moving Average's and both sitting within Fib. retracement zones.

Crude has been in this persistent selling channel for 13-days already (as though waiting for a catalyst to break out in either direction).

Copper - has a 50% Fib. projection which aligns with its 61.8% retracement level right around the $3.38-$3.4 area.  The moving averages sure seem to be setting up in a bearish orientation.

Tuesday, May 22, 2012

Bounce

The broad markets got a bounce, and just shy of the 38% Fib. retracement and 100% Fib. projection.

Saturday, May 19, 2012

Gold

If for nothing else, I love the Gold market simply for the fact that it has two very diametric viewpoints to where price is going and the opinionated will defend those viewpoints with utmost venom.  With that said:

What if Gold has NOT topped out, but is merely in a corrective phase?  As the sayings go; a trend is more likely to continue than reverse, and, trend's end in a climax.  I would posit that we have seen trends end in a climax before (Crude Oil in the latter half of  '08 for example) where the selling is relentless and unforgiving,  and yet, Gold has been within a range for close to a year now, not very climactic if you ask me.

With an issue that has such a mature trend it makes sense to analyze it on a big picture time frame.  So, here we have a monthly chart of the Gold market:

The large corrective cycles in 2 previous periods has averaged 18-months.  So far we are in our 9th month since seeing the highs sold in September of 2011.  If this were the half-way point in a corrective cycle it would match perfectly with out average 18-month corrective cycle.

On a smaller time frame we can see how each of these corrective phases trace out a distinct pattern:


Looking a little closer at this year's price discovery we can see three instances (the most recent of which has been this past week) of buying tails at support, also known as three pushes to a low?

Basically what I'm trying to say is that the decade-long Gold trend, in my opinion,  has not yet "ended in a climax.  Rather, it appears to be in yet another corrective phase.  My premise would be proven wrong with bearish momentum that slices through various layers of support in the coming months.  If correct, that would mean we're roughly half way through a corrective phase that could lead price to a retest of previous highs. For now; It ain't over 'til it's over.


Friday, May 18, 2012

ES Update

Updated ES chart from earlier in the week.  Also added is a Fibonacci level drawn off of the October lows to March highs where there is a confluence of Fib. support around the 1380-1385 mark.

Thursday, May 17, 2012

keeps going

Looking for a relief rally, if not on Facebook Friday OpEx, then when?
Markets to watch in my opinion include;
The U.S.Dollar Index, possibly stalling at double-top resistance, but has had a momentum week, so traders should be looking to buy pullbacks going forward

This weekly chart sure looks like a cup with handle pattern going back to the beginning of 2011:

Treasury yields continue to fall, the 10-year making an all time low today.

TLT as a proxy just shy of making an all-time high

30-year weekly:

5-year weekly wedge, looks like it can either bounce at the lower channel or just flush lower.  Possibly even a false breakdown that causes a squeeze higher?:

10-year daily chart; Interesting that the 10-year yield finds itself at a pivot low while the Dollar index is at pivot resistance.

Particularly intriguing that the 30-year didn't participate in the equity market rally that we saw.  It only started breaking out once equities were topping

Monday, May 14, 2012

ES targets

First potential target to watch for on the ES I'm looking at 1318.75.  See how it plays out

Saturday, May 12, 2012

gold

Things have been looking bleak for gold and it's long-term trend line break.

There remains hope in the weekly with the potential inverse Head & Shoulders on momentum divergence while the daily has a very orderly daily channel in play


Fri 5_11

Just a look at the intraday Friday.  Strong pullback in a bearish trend after a momentum gap down.
QQQ held the previous day's low and managed to fill the 5/8 gap but faded back to previous value area

SPY - strong move into resistance faded

IWM - $79.50 resistance is key

DIA - clear resistance base being established in these indices

XLE - $68.50 base

Friday, May 11, 2012

AMZN 2d

AMZN 2c-2d setup this morning coming on the heels of a 3d setup the previous day.

Tuesday, May 8, 2012

Divergence

Buy divergence setting up in the SPY and though a relief rally may be in the cards this week the lower high is still looming over this market

As most broad indices are experiencing a 20- & 50-MA crossover the common reaction to a technical bearish crossover is for price to revert back higher to gauge whether those averages are accepted or rejected.  Failure to reclaim the 50-day MA in the SPY would be perceived as weak, whereas recovering this technical level could prove this to be merely a corrective phase before fresh highs are achieved.

It is important to keep the perspective of the weekly chart in mind as well.  Price is very much within support and looks to be setting up a 2c-2d long setup.

The QQQ for example has registered a fresh momentum low

but in the context of the weekly that fresh momentum low looks like it may attract the fade-players.  Interestingly enough, the QQQ could lose another 7% and have very solid support.

The DIA is still safely inside this sideways price channel

and in the context of the longer-term picture, a mere 8.9% off of all-time highs

IWM is holding support (on a buy divergence)

and 8.7% off of all-time highs though I'll admit, this chart looks most fragile than the others

TLT projection

The TLT finally reached its 100% Fib. projection today off of the impulse seed wave formed back in April.

Monday, May 7, 2012

corrective cycle

While the Stevenson PTT concept is a bit difficult to read in trending markets it does tend to be clearer in range-bound or corrective markets.  Take the SPY for instance;  going back over the past month price has adhered to roughly a 10-day cycle while it tries to determine a direction for a more sustained move.

I have never really been satisfied with the reliability of the Stevenson target projections (red line), but the CTL (purple line) usually holds true to definition (CTL = Cyclic Trend Line, where a close outside this line indicates the beginning of your next cycle phase).

Here was another classic corrective cycle last summer with very symmetrical cycle lengths

Wednesday, May 2, 2012

Wed. 5_2

The SPY is still hanging in there around the apex of the "W" pattern.  A neutral but bullish leaning bias with price between the $139.5-$141 level.  Above $141 may bring fresh highs, but under $139 could lead to a gap fill  from the 25th.

there remains the potential for this Head & Shoulders to play out

Tuesday, May 1, 2012

tues 5_1

An example of the 2d setup that ends up reversing rather than continuing the trend direction.
The 2b setup often shows itself as an inverse H&S on the faster time frame and simply highlights a higher low in the pullback of a trend.  However, if price fails to push through resistance there is the potential for a 2b short setup, which is what we saw here today.  The long was scratched for a little more than b/e.