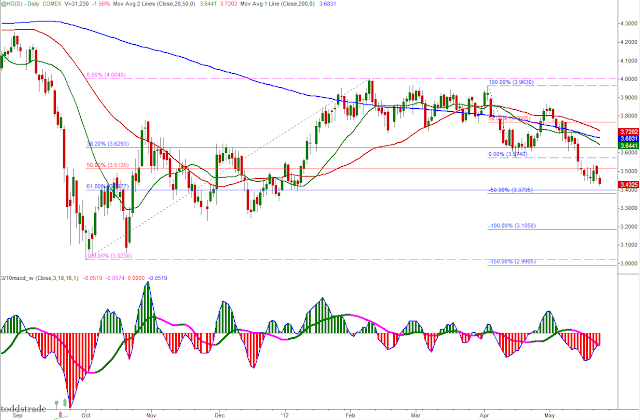
Just a quick chart update on Crude and Copper being that I haven't posted a chart of either in a while.
Both below their 200-day Moving Average's and both sitting within Fib. retracement zones.
Crude has been in this persistent selling channel for 13-days already (as though waiting for a catalyst to break out in either direction).
Copper - has a 50% Fib. projection which aligns with its 61.8% retracement level right around the $3.38-$3.4 area. The moving averages sure seem to be setting up in a bearish orientation.
The setups I include on this blog are used in conjunction with the 3/10macd and the criteria I ascribe to it as a way to alert me to an existing condition of price. The key concept to take away from this blog is that I try to anticipate what will happen on the higher time frame by using a faster time frame to trigger the trade setup. I do not trade a "system" I use two indicators to clue me in to price conditions. Please read the Disclaimer located in the sidebar of this site. I can be contacted via email at toddstrade@gmail.com
I am always open to questions, comments, or suggestions on how to improve this blog.


No comments:
Post a Comment