

Showing posts with label updates. Show all posts
Showing posts with label updates. Show all posts
Wednesday, November 9, 2011

Tuesday, August 30, 2011
updates
Two quick updates to previous posts regarding the SPY.
First the obvious; Price continues to squeeze higher but has yet to tag the Fib. projections that I drew out in this post.

Meanwhile, the follow-up to this post regarding the higher time frame 3d setup that triggered on Aug. 23 came within 45-cents today of tagging the first target, the 50% Fib. projection. Price seems to be struggling to move higher at this point and as such a pullback wouldn't be surprising.

Reached the 50% projection of the intermediate seed wave:

First the obvious; Price continues to squeeze higher but has yet to tag the Fib. projections that I drew out in this post.

Meanwhile, the follow-up to this post regarding the higher time frame 3d setup that triggered on Aug. 23 came within 45-cents today of tagging the first target, the 50% Fib. projection. Price seems to be struggling to move higher at this point and as such a pullback wouldn't be surprising.

Reached the 50% projection of the intermediate seed wave:

Friday, September 3, 2010
updates from the week ending 9/3
A couple of updated charts:
The IWM is back inside it's long-term pitchfork (though tired as it looks), as updated from this post
 While the shorter-term pitchfork shows the SPY making a move toward it's mid-line, which happens to coincide with a 200-day MA (and a lower high incidentally).
 The momentum buy divergence as mentioned in this post, while giving some heat, did work out. The stop loss order should have been below the entry bar's low anyway.
 The markets bounced with some momentum this week as we were looking for from this chart but it's all about the follow-through up to and/or over $113
 and how about that Lehman gap, I mean come on!
 All-in-all we've been inside this range for quite some time, and could be here for more time to come. We could even look at price as if it were an unbounded oscillator, with the overbought/oversold levels shown by the red and green horizontal lines respectively (and keeping in mind that a market can remain overbought, or oversold, for long stretches of time as it did in March-April).

The IWM is back inside it's long-term pitchfork (though tired as it looks), as updated from this post
 While the shorter-term pitchfork shows the SPY making a move toward it's mid-line, which happens to coincide with a 200-day MA (and a lower high incidentally).
 The momentum buy divergence as mentioned in this post, while giving some heat, did work out. The stop loss order should have been below the entry bar's low anyway.
 The markets bounced with some momentum this week as we were looking for from this chart but it's all about the follow-through up to and/or over $113
 and how about that Lehman gap, I mean come on!
 All-in-all we've been inside this range for quite some time, and could be here for more time to come. We could even look at price as if it were an unbounded oscillator, with the overbought/oversold levels shown by the red and green horizontal lines respectively (and keeping in mind that a market can remain overbought, or oversold, for long stretches of time as it did in March-April).
Wednesday, September 1, 2010
squeezed
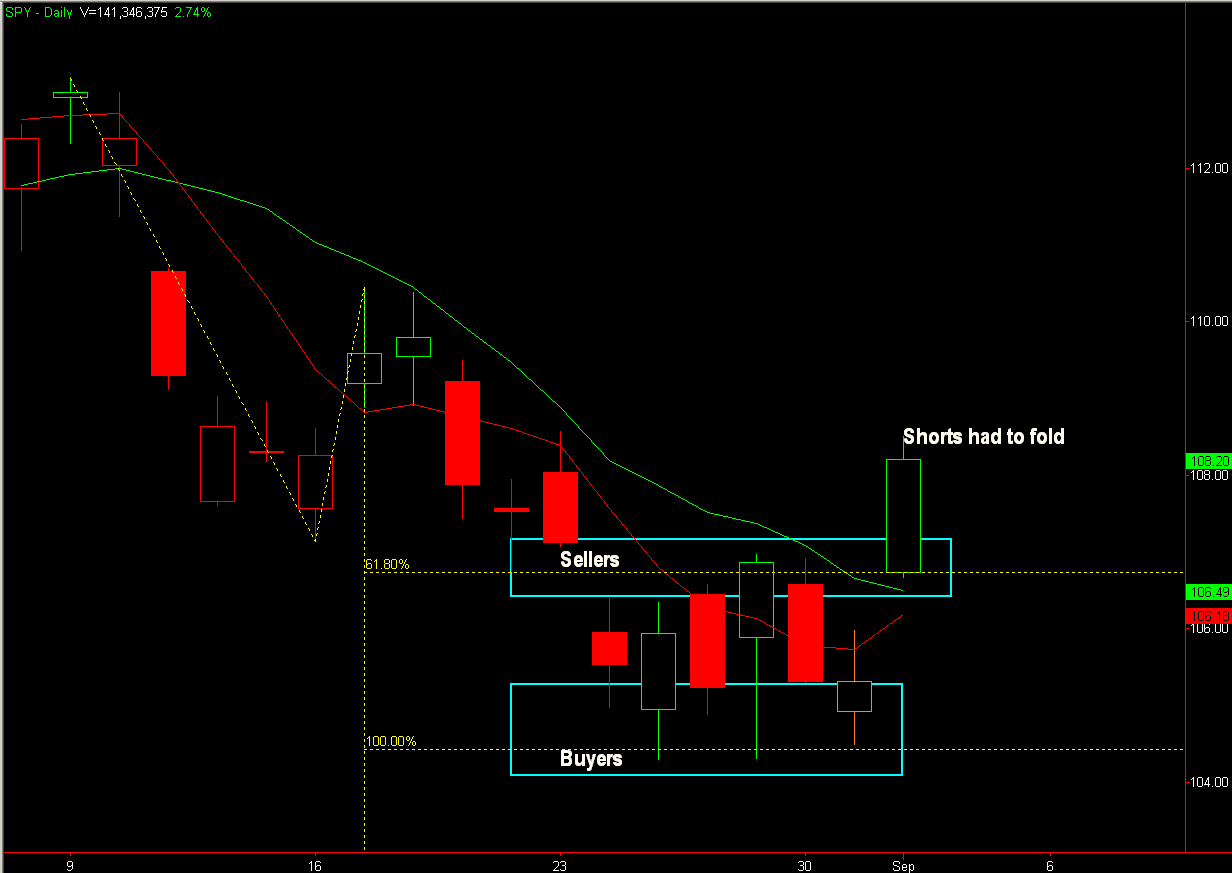
Part of the game is knowing who will need to cover in the event of an adverse move. In today's case, much of the short side was forced to cover their hand. Updated chart from this previous post:
Tuesday, August 24, 2010
updated charts


Saturday, August 21, 2010
What also didn't work
Following up on this post HERE
I still contend that the bullish wolfe wave is intact, but anything can happen at this point.
The current lows have a buy divergence going for it on the daily chart. Being that this could be perceived as a double bottom it could contain a tradeable bounce. Should the bottom give way, this weekly chart shows $35 as a reasonable target for support in the weeks ahead.
I still contend that the bullish wolfe wave is intact, but anything can happen at this point.
The current lows have a buy divergence going for it on the daily chart. Being that this could be perceived as a double bottom it could contain a tradeable bounce.
 Should the bottom give way, this weekly chart shows $35 as a reasonable target for support in the weeks ahead.
well that didn't work
Updated from HERE regarding the Falling Three method candle pattern on the AKAM weekly.
Was looking for weakness, but AKAM just kept getting stronger until it broke out of a really nice base.

Was looking for weakness, but AKAM just kept getting stronger until it broke out of a really nice base.


Thursday, August 19, 2010
TLT update
Bullish Wolfe Wave updated from {here} The upper median line happens to lie just below the wolfe wave target line

 The upper median line happens to lie just below the wolfe wave target line
Friday, August 13, 2010
Update
Recently updated blog post.
Also, the last four weeks in the ES (60-min time frame) including the Stevenson Cycles and bar count.

Also, the last four weeks in the ES (60-min time frame) including the Stevenson Cycles and bar count.


SPY Wolfe Wave done
Bullish Wolfe Wave failed at resistance
Updated chart of the SPY bullish Wolfe wave that was last posted {here} Things are getting awfully stretched, which could bode well for the target (red) line being met (+/1 $115-116). Things to watch for imho would be an exhaustion move with large volume before retracing.

Updated chart of the SPY bullish Wolfe wave that was last posted {here}
 Things are getting awfully stretched, which could bode well for the target (red) line being met (+/1 $115-116). Things to watch for imho would be an exhaustion move with large volume before retracing.
Thursday, July 29, 2010
a recurring theme
On the heels of a previous post...Short setups in RIMM and FCX
First, we have an established range with S/R which will give us potential targets on the breakdown move (also worth noting, the overhead Supply in this case is an earnings miss gap down): We get a few bounces off of support, only to see buying interest wane before the breakdown:
Same situation in FCX

How fast the tide turned: RIMM ended the day in a long-legged doji after tagging it's 50-SMA

First, we have an established range with S/R which will give us potential targets on the breakdown move (also worth noting, the overhead Supply in this case is an earnings miss gap down):
 We get a few bounces off of support, only to see buying interest wane before the breakdown:
Same situation in FCX


How fast the tide turned:
 RIMM ended the day in a long-legged doji after tagging it's 50-SMA
I'm not buying it, you buy it...
Following POT earnings we saw a price liftoff on strong volume, only to see the move faded once hitting that overhead supply range ($100-$101). Have we noticed a theme yet of beat earnings moves being faded??
At any rate, here's the overhead supply zone as posted last night: Following a failure test of the highs, price formed a seed wave, giving 2 primary targets. I'll post an end of day update on this chart
 It's a funny thing to see strong buying (as evidenced by the green volume bars) into a move, but the overhead supply concept will win out every time (initially anyway, this could be a mechanism to flush out "weak" hands and we could base and consolidate between this $97-$100 range for a while longer, it just depends on how much demand there is).
...should have bought it...what a move!
At any rate, here's the overhead supply zone as posted last night:
 Following a failure test of the highs, price formed a seed wave, giving 2 primary targets. I'll post an end of day update on this chart
 It's a funny thing to see strong buying (as evidenced by the green volume bars) into a move, but the overhead supply concept will win out every time (initially anyway, this could be a mechanism to flush out "weak" hands and we could base and consolidate between this $97-$100 range for a while longer, it just depends on how much demand there is).
...should have bought it...what a move!

Wednesday, July 28, 2010
short setup
Along the lines of a previous post, here's a similar setup in VMW today:
Price is within a range with established Support/Resistance levels
 Price broke down once buying interest waned, ideal entry is on a mini bear flag
 end of day update
Price is within a range with established Support/Resistance levels
 Price broke down once buying interest waned, ideal entry is on a mini bear flag
 end of day update
Sunday, July 25, 2010
FCX cont.
Recent updated chart. Worked nicely. Looks to me like a correction of some sort could be expected for the early part of this coming week.
updated from here
FCX reports tomorrow morning at the open.
So far, it has had this nice channel setup, where the breakout cycle is similar to a shoulder (61.8% retracement of the previous cycle): The larger picture is still down for now

 Price is currently right up against the 50-MA with the 20-MA just below
intra-day S/R:

updated from here
FCX reports tomorrow morning at the open.
So far, it has had this nice channel setup, where the breakout cycle is similar to a shoulder (61.8% retracement of the previous cycle):
 The larger picture is still down for now
 Price is currently right up against the 50-MA with the 20-MA just below
intra-day S/R:

Tuesday, July 20, 2010
TICK extreme
Another NYSE TICK extreme off of a previous post {here}
Going back as far as my platform allows, TICKs greater than 1600 and weaker than -1800 are few and far between. Recently, we've had two TICKs > 1600 (today was one of them) in the last 4-days. While the "flash crash" was the lowest TICK reading in over 12-years.
 curious
Going back as far as my platform allows, TICKs greater than 1600 and weaker than -1800 are few and far between.
 Recently, we've had two TICKs > 1600 (today was one of them) in the last 4-days. While the "flash crash" was the lowest TICK reading in over 12-years.
 curious
Monday, July 19, 2010
updated
From yesterday's post. The first scenario played out closer than anything...Big buyer's aren't stepping up unless there's an earnings catalyst.
Price gaped down slightly, made a push to test the previous day's swing high, but a failure printed a lower high, leading to selling throughout the day.
Price gaped down slightly, made a push to test the previous day's swing high, but a failure printed a lower high, leading to selling throughout the day.

Wednesday, July 14, 2010
updated chart
Updated SPY chart from {here}
Amazing how after three pushes to a bottom price touched the pitchfork mid-line on the nose and made a Beeline for the Upper Median Line.

and the bullish Wolfe Wave is still in play!

Amazing how after three pushes to a bottom price touched the pitchfork mid-line on the nose and made a Beeline for the Upper Median Line.

and the bullish Wolfe Wave is still in play!

Subscribe to:
Posts (Atom)