

Showing posts with label Fib targets. Show all posts
Showing posts with label Fib targets. Show all posts
Friday, May 18, 2012
ES Update
Updated ES chart from earlier in the week. Also added is a Fibonacci level drawn off of the October lows to March highs where there is a confluence of Fib. support around the 1380-1385 mark.


Wednesday, July 6, 2011
I'll Buy That
Green hammer on the 15-min chart, I'll buy it any day

5-min breaks down as such; entry off the break of the 15-min hammer bar's high, exit as resistance. Second entry based on inverted H&S, exit at 100% projection of the initial wave
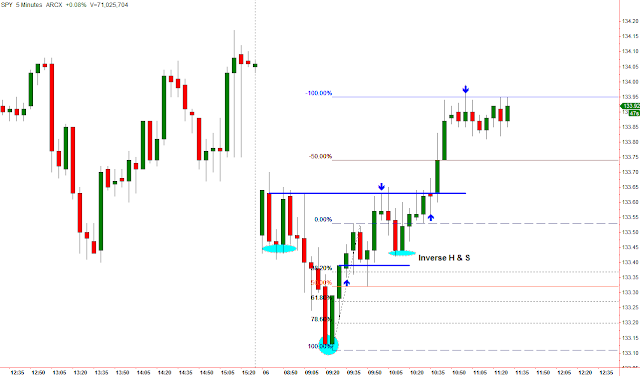

5-min breaks down as such; entry off the break of the 15-min hammer bar's high, exit as resistance. Second entry based on inverted H&S, exit at 100% projection of the initial wave

Tuesday, May 10, 2011
review
Today's SPY with modified TICK. The only substantial negative TICK was registered on a higher price low. The Fib. projections are based off of the PDC measured to the days Open:

The trend is your friend. The last two moves off the March lows (how many "March lows" have been bought since '08?) have retraced 50% before extending higher. There's a confluence of Fibonacci projections/extensions at the $139.31 level and beyond that at $140.70-ish.


The trend is your friend. The last two moves off the March lows (how many "March lows" have been bought since '08?) have retraced 50% before extending higher. There's a confluence of Fibonacci projections/extensions at the $139.31 level and beyond that at $140.70-ish.

Thursday, April 21, 2011
SLV
The trend is up.
15-min chart the momentum push was the lowest reading in over a week while the swing low was higher than the previous day (just above the PDH). It's a reverse divergence, but I believe LBR coined in a "Sling Buy" setup. The 15-min hammer candle doesn't get any prettier. While the 5-min trigger could have been a 3/10 macd Fast Line/Slow Line crossover, but a better entry was following the consolidation off the bottom as price formed the seed wave.
Half target was the 50% entension of the seed wave which coincided with the breakdown point of the selloff.
100% and 200% extensions of the seed wave were both met the next day.

15-min chart the momentum push was the lowest reading in over a week while the swing low was higher than the previous day (just above the PDH). It's a reverse divergence, but I believe LBR coined in a "Sling Buy" setup. The 15-min hammer candle doesn't get any prettier. While the 5-min trigger could have been a 3/10 macd Fast Line/Slow Line crossover, but a better entry was following the consolidation off the bottom as price formed the seed wave.
Half target was the 50% entension of the seed wave which coincided with the breakdown point of the selloff.
100% and 200% extensions of the seed wave were both met the next day.

Sunday, April 17, 2011
Talk My Book
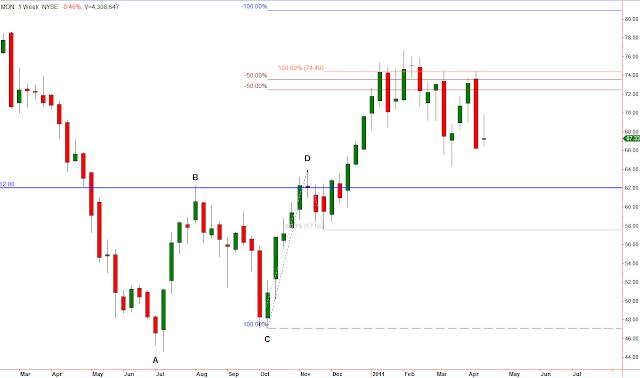
For the case of MON short
First the weekly:
A Falling Three Method Candle pattern and the past week was rejected from a 2x momentum bar

Doing some Fib. Projections;
-Measuring A to B and projecting off of C to get a 50% projection.
-Measuring C to D and taking the 50% projection and
-Taking a 100% extension of C to D we get a confluence of resistance that was quite thoroughly tested. While eyeballing a support level $62 area was a fair resistance point previously:
On the Daily we have:
-A bear flag
-Strong volume on the sell-off
-3/10 macd signaling a first cross sell signal (4c criteria).
Below price we have the 200-day MA and a 50% midpoint from a 2x momentum day, right around the $62 level.

Adding some Fibonacci projections:
A-B-C 100% extension
C-D 50% projection
D-E 100% projection
All converge at the 200-MA & 2x momentum bar midpoint at the $62 level.

First the weekly:
A Falling Three Method Candle pattern and the past week was rejected from a 2x momentum bar

Doing some Fib. Projections;
-Measuring A to B and projecting off of C to get a 50% projection.
-Measuring C to D and taking the 50% projection and
-Taking a 100% extension of C to D we get a confluence of resistance that was quite thoroughly tested. While eyeballing a support level $62 area was a fair resistance point previously:

On the Daily we have:
-A bear flag
-Strong volume on the sell-off
-3/10 macd signaling a first cross sell signal (4c criteria).
Below price we have the 200-day MA and a 50% midpoint from a 2x momentum day, right around the $62 level.

Adding some Fibonacci projections:
A-B-C 100% extension
C-D 50% projection
D-E 100% projection
All converge at the 200-MA & 2x momentum bar midpoint at the $62 level.

Tuesday, January 11, 2011
doji day
While price bounces within a 1% range

Price gaped up about 0.5% and sold off nearly to the 50% retracement as measured from the PDC to the day's Open. After finding support price then extended to a 50% extension of this measurement

This extension also corresponded with a 50% extension of the previous day's range (measured off the PDL to PDH)

Practically no bearish TICK bias until later in the afternoon (ignore the first trendline indicating a divergence, as it is not)

Sailing away we are


Price gaped up about 0.5% and sold off nearly to the 50% retracement as measured from the PDC to the day's Open. After finding support price then extended to a 50% extension of this measurement

This extension also corresponded with a 50% extension of the previous day's range (measured off the PDL to PDH)

Practically no bearish TICK bias until later in the afternoon (ignore the first trendline indicating a divergence, as it is not)

Sailing away we are


Tuesday, December 7, 2010
SPY Fibs
Interesting results today using Fibonacci to project price targets on the SPY
Starting with the Dec.01 momentum gap up (using the 11/30 Close to the Dec. 1st Open) price reached a 200% extension (outside retracement) on today's Open.

Today's Open coincided to around a 150% extension of the previous day's range, while price was supported throughout most of the day at the 50% retracement measured off of the PDC and today's Open

Meanwhile, on a broader perspective, price was rejected from trading above it's 61.8% Fib. retracement today


Starting with the Dec.01 momentum gap up (using the 11/30 Close to the Dec. 1st Open) price reached a 200% extension (outside retracement) on today's Open.

Today's Open coincided to around a 150% extension of the previous day's range, while price was supported throughout most of the day at the 50% retracement measured off of the PDC and today's Open

Meanwhile, on a broader perspective, price was rejected from trading above it's 61.8% Fib. retracement today


Tuesday, November 30, 2010
patience
A trade in FCX today which demonstrates the importance of patience (and FCX can teach a graduate course in patience). Price showed an ascending consolidation triangle after a momentum gap fill move. I measured the momentum from the 9:15 (CST) breakout up until price consolidated to arrive at potential targets (50% & 100%) which were both hit (as soon as I got out).


Monday, November 15, 2010
using momentum
An issue I've always had when in a trade, or looking to enter a trade, was trying to project where my price target should be. I'm flipping through daily charts, looking at wicks, moving to 30min chart bollinger bands, getting a target number in mind and then wondering, "Why'd price stop there and not my arbitrary target?"
One of the easier methods I have found for projecting a target (for at least half position) is simply projecting a Fib. Retracement off of the most recent momentum impulse and using the 50% extension as my "at least" target. In other words, a measured move, dur!
Momentum Impulse
A movement in price that exhibits a wider range in a shorter period of time. Of course this is relative to the issue and timeframe you're looking at, but it should be obvious when you look at a chart and see big versus not so big bars, and sideways versus linear movement. Especially obvious in the opening session where there are gaps with continuation or rejection.
Here are two examples from today:
APA gaped up this morning and within 10-min retraced half of the Close-Open gap range. Normally I would look for support from this 50% level, so a failure can tip off weakness.

The 50% retracement failure led to a gap fill, giving us a momentum leg. I'll then measure these 3 candles, as it represents momentum.

At this point I wait and see how/if/where price is going to retrace this momentum impulse. APA showed a wick rejection close to the 50% retracement (an excellent confirming signal!) so I'm thinking short and looking for any further retrace testing. What followed was increasingly narrow price contraction before a failure of the lows.
My primary target = 50% extension off of the initial impulse. Afterwards you can judge strength of price for potential further downside. As you can see, each extension level (50% and 100%) was sliced through on a solid bar, while the 150% extension was wicked and followed by short covering.

RIMM had a similar open this morning. Momentum on the gap up, but the 50% failed to hold any support, instead showed strong downside momentum.
 Following this downside momentum price wicked no more than 38% of it's previous momentum. Price then broke down, hitting our primary and secondary targets (50% & 100% extensions), though instead of slicing through them (as they did in APA) they were wicked (not necessarily a sign of continuing momentum).
 So, once we can pinpoint momentum we can at least determine a primary target and size our position accordingly.
As an aside:
I've noticed that when you have strong directional momentum that isn't immediately tested (like in the APA chart where we had a wick test near the 50% almost immediately) then price tends to drift back in that direction for a test. Case in point, AGU today, notice how we have 15-minutes of downward price momentum and zero testing of the previous bar's range. Once price found support it then drifted up to test the range that it previously sliced through:

One of the easier methods I have found for projecting a target (for at least half position) is simply projecting a Fib. Retracement off of the most recent momentum impulse and using the 50% extension as my "at least" target. In other words, a measured move, dur!
Momentum Impulse
A movement in price that exhibits a wider range in a shorter period of time. Of course this is relative to the issue and timeframe you're looking at, but it should be obvious when you look at a chart and see big versus not so big bars, and sideways versus linear movement. Especially obvious in the opening session where there are gaps with continuation or rejection.
Here are two examples from today:
APA gaped up this morning and within 10-min retraced half of the Close-Open gap range. Normally I would look for support from this 50% level, so a failure can tip off weakness.

The 50% retracement failure led to a gap fill, giving us a momentum leg. I'll then measure these 3 candles, as it represents momentum.

At this point I wait and see how/if/where price is going to retrace this momentum impulse. APA showed a wick rejection close to the 50% retracement (an excellent confirming signal!) so I'm thinking short and looking for any further retrace testing. What followed was increasingly narrow price contraction before a failure of the lows.
My primary target = 50% extension off of the initial impulse. Afterwards you can judge strength of price for potential further downside. As you can see, each extension level (50% and 100%) was sliced through on a solid bar, while the 150% extension was wicked and followed by short covering.

RIMM had a similar open this morning. Momentum on the gap up, but the 50% failed to hold any support, instead showed strong downside momentum.


As an aside:
I've noticed that when you have strong directional momentum that isn't immediately tested (like in the APA chart where we had a wick test near the 50% almost immediately) then price tends to drift back in that direction for a test. Case in point, AGU today, notice how we have 15-minutes of downward price momentum and zero testing of the previous bar's range. Once price found support it then drifted up to test the range that it previously sliced through:

Subscribe to:
Posts (Atom)