The setups I include on this blog are used in conjunction with the 3/10macd and the criteria I ascribe to it as a way to alert me to an existing condition of price. The key concept to take away from this blog is that I try to anticipate what will happen on the higher time frame by using a faster time frame to trigger the trade setup. I do not trade a "system" I use two indicators to clue me in to price conditions. Please read the Disclaimer located in the sidebar of this site. I can be contacted via email at toddstrade@gmail.com
I am always open to questions, comments, or suggestions on how to improve this blog.


Friday, April 29, 2011

one setup

If I look for nothing else, the 3d setups should be it:
- Stable trend on the 15-min 3/10 macd slow line as the fast line corrects into it.
- Enter on a trigger of either the 5-min 3/10 macd slow line ticking up (aggressive) or turning positive.
GS

POT
The only one of the three that I actually traded and for some unknown reason I actually baled on this trade!  Have no idea why I got out, no idea.

FCX

Wednesday, April 27, 2011

pre-FOMC

Most FOMC days have early opportunity before the markets go into a lull as the announcement approaches.
VXX long 3d setup (technically the criteria is 1d, but the strength of the setup is the trend of the slow line and the fast line correcting into it).  I mentioned the other day that the 3d setup occurs later in the day but can carry through into the next morning session.  It's integral to know where overhead resistance is so you can anticipate the dynamic move that comes from trailing stops and/or long positions being initiated.  The 5-min chart of the VXX has two arrows; the leftmost is where the trade technically triggered based on the 3/10 macd and the rightmost where the actual entry was as resistance was taken out (actual R:R was much better on the left arrow).  Fib. projections (15-min chart) based off of the previous day's seed wave.

Mentioned yesterday was to watch MEE and its developing H&S pattern.  This short setup was a breakdown out of a flag and a bounce at the H&S daily neckline:

Tuesday, April 26, 2011

to watch

Worth keeping an eye on this descending triangle in MON

and potential Head & Shoulders pattern in MEE

a lot on the table

Started the day with old nasty habits creeping back in (shorting strength and not taking my setups) but made it all back in VLO, where I then proceded to leave a lot on the table.  Not sure why I didn't get back in though after the consolidation at the 50% retracement for a target of the Open.  Got in under vwap and out at $28.90.

I got in long on X just before the 1:00 hour, got out with a small loss and then re-entered long after the 3d setup triggered.  Short and quick target to vwap.
Other trades today were marginal.

Monday, April 25, 2011

3d setups

Just some examples of the 3d setup which ocurred today.
The main prerequisite is that the negative slow line has a nice trend/slope to it.  They can happen at any time, but I find that they often set up mostly around the 1:00-2:00 CST hour or can carry in to the next session.
GS - The better of the 3.  A double-bottom put in by an inverted hammer that was also a tweezer candle pattern.  The entry (fast line turning green on the 5-min chart) was never re-tested.

STT - I have 3 arrows (5-min chart) for 3 possible entries; a tick up in the fast line of the 3/10 macd (aggressive), waiting for the fast line to turn green (second arrow), or waiting for the resistance level to be broken above vwap.  Whichever way played it would have been a challenge.

POT - one I actually got involved with.  The slow line on the 15-min chart didn't have much of a trend to it.  The first arrow (5-min chart) was where I placed a limit order, that was touched but never filled.  I failed to come back to this later in the day even though I was aware of the ascending triangle it was forming.

fwiw

Potential Wolfe Wave setup in the SPY.
If you recall; Point 2 (which you can only find after points 1 & 3 have already been formed) does not have to be a long term trend reversal, only a significant swing high or low.
Point 5 marks the trigger "sweet spot" for a short where strong volume would be preferable.
While the red line projects the target.

Thursday, April 21, 2011

sucky trades

AGU from Wednesday.  Short attempt, got stopped out after putting a tight stop above the narrow range consolidation (horizontal line and up arrow).  Was good for about 30 cents, so I guess it wasn't that sucky.

VLO from today.  I had higher hopes for it, but couldn't stick around for it to work at the end of the day, so I took myself out when price came back below $28.90, which I believe gave me 7-cents!

SLV

The trend is up.
15-min chart the momentum push was the lowest reading in over a week while the swing low was higher than the previous day (just above the PDH).  It's a reverse divergence, but I believe LBR coined in a "Sling Buy" setup.  The 15-min hammer candle doesn't get any prettier.  While the 5-min trigger could have been a 3/10 macd Fast Line/Slow Line crossover, but a better entry was following the consolidation off the bottom as price formed the seed wave.
Half target was the 50% entension of the seed wave which coincided with the breakdown point of the selloff.
100% and 200% extensions of the seed wave were both met the next day.

Tuesday, April 19, 2011

quiet day

The only thing I traded today was MON.  Two shorts, one for about 45-cents the other for 20-cents.
The first short trade was an "Avalanche" setup (Not that I'm recommending you buy it, you could just ask me about it :)  Price found support at the 50% retracement of the opening range.  Couldn't really expect more out of it with such a strong impulse off the open and strength in Ag. names today.
The end of day was a scalp following a big sell order.  Had my sell short order in at $62.09 (a low volume node) and pulled it 30-min before it tagged $62.09 and large volume sent it back to vwap.  Live and learn.

better or worse

Please vote as to whether a blue background chart is preferable to a white background chart.  Also, whether the horizontal/vertical grid is preferred (shown on the 15-min but not the 5-min).
Thank you for input.

Monday, April 18, 2011

more setups

XLE was a good 3d setup.  Price formed a cup w. handle pattern while the trigger came about at the end of the handle.  Two ways to measure for a target; measure A-to-B as indicated on the 15-min chart (correction; the 'A' should be 4 bars over, being that it's a double bottom the extension is the same).  The other measurement indicated on the 5-minute chart is a seed wave.  Otherwise the PDL was a realistic target without using Fib.s.

I traded BHI today very briefly, but not to the extent that it set up as indicated.  The gap down was a strong impulse that created a reverse divergence.  What followed was a seed wave where price succeeded in reaching a 100% extension.  The 5-min chart set up a First Cross long entry where the Slow line goes positive just as the fast line is correcting into it:

half-a-man

AAPL sell-off on the open consolidated after the first 15-minutes for over an hour, forming a V-bottom on the macd (mentioned in two posts last week).  The lesson here is to wait for a cross of the fast and slow line on the 15-min 3/10 macd, but you can anticipate this behavior buy entering on the 5-min 3/10 turning green (again, the cup & handle pattern on the 5-min macd).  First exit was for $1 at vwap, second exit was for another $1, but I should have re-entered later in the day to catch the second half of this move.  Price returned right back to the previous day's breakdown point.

Sunday, April 17, 2011

Talk My Book

For the case of MON short
First the weekly:
A Falling Three Method Candle pattern and the past week was rejected from a 2x momentum bar

Doing some Fib. Projections;
-Measuring A to B and projecting off of C to get a 50% projection.
-Measuring C to D and taking the 50% projection and
-Taking a 100% extension of C to D we get a confluence of resistance that was quite thoroughly tested.  While eyeballing a support level $62 area was a fair resistance point previously:

On the Daily we have:
-A bear flag
-Strong volume on the sell-off
-3/10 macd signaling a first cross sell signal (4c criteria).
Below price we have the 200-day MA and a 50% midpoint from a 2x momentum day, right around the $62 level.

Adding some Fibonacci projections:
A-B-C 100% extension
C-D 50% projection
D-E 100% projection
All converge at the 200-MA  & 2x momentum bar midpoint at the $62 level.

Saturday, April 16, 2011

symmetry, force, velocity

  Just an interesting observation of price symmetry.
  Looking at a SPY weekly chart going all the way back to the start of cheap credit and Ãœber leverage.
- 266 weekly bars on the way Up, and half as many on the way Down, 133.
- Another 261 (roughly twice as many) weekly bars on the way back up to a double top (key technical "topping signal").  At this point we have a nearly perfect symmetrical cycle with a 2:1 up/down ratio; up, down, up to re-test, fail.
- The Double-top failure was 73 bars down, or roughly one-third the amount of time it took to test the highs.  
- Since then we have traveled 103 weeks up, or One & one-third the time to retrace higher. 


- So, in this case we had two symmetrical waves moving happily along until acted upon by a force (i.e. Double Top supply). Put another way, an object in motion tends to stay in motion until an outside force is applied.  So, we get an outside force (Double Top supply) at which time there is a reaction whose velocity is determined by its Force.  If the Force (F) is the 261 up bars and the (a)cceleration = 73 bars down and F=m*a or 261=m*73 then m=3.5, so the velocity changed at a rate of 3.5 times.  What does it all mean?  Who cares.  But it is what Andrews (from Babson) was analyzing through his use of Pitchforks.  The pitchfork (or Andrews Median Line) highlights the vector which price will move within once the force and acceleration (action/reaction) are measured.

Looking closer we can add one more pitchfork off of the March '09 lows:
('UML' = Upper Median Line, and 'Mid-Line' are from the longer-term chart above).  What I'm trying to point out is the confluence of the 3 separate pitchforks where price currently sits.


Anyway, adding some Fib. retracements in for good measure; the 78.6% has capped previous moves for these cycles.

While measuring the largest wave in the most recent move and projecting a Fib. extension off of it gives us the following:
As an aside, I'm not totally well versed in price projections, aside from what feels natural to me.  But measuring the 1, 3, & 5 waves off of the March '09 lows and projecting them off the beginning of our move higher starting back in Oct. '10, a confluence of resistance lies around the$140 & $143 levels.


Friday, April 15, 2011

Just a little piece

All I wanted from this AMZN trade was a tag of the 50% retracement (measured from the PDC to today's Open).  A little over 60-cents, with a ridiculously close stop.  I mentioned the pattern yesterday of a 3/10 macd V-bottom where you wait for the Fast Line & Slow Line to cross over on the 15-min chart.  But you can anticipate this crossover by watching the lower time frame (notice how the 5-min 3/10 macd forms a cup & handle pattern before breaking higher).  I considered buying a return to the Open but the pullback entry never really set up.

upcoming webinar

Jim Dalton webinar for April 21, 2011 4:30 p.m. EST sign-up:

Thursday, April 14, 2011

I thought I was done....

....but RIMM pulled me back in.  I took 
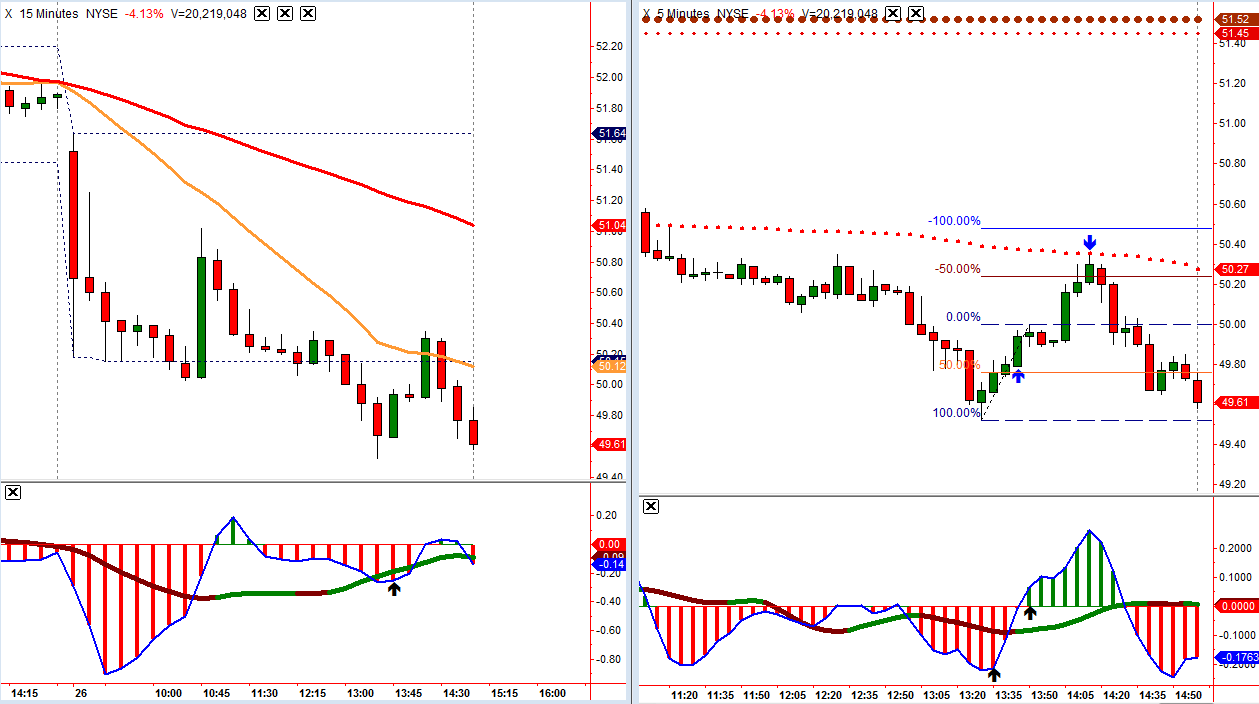
RIMM off my watchlist a while ago, but still peek at it every now and again.  The setup was a double bottom, with a strong momentum candle followed by a tight flag.  Target was initially the 50% extension measured off of the W-bottom wave, but it was showing strength at that point (as was the rest of the market), so a target after that was the 100% extension.  Not that you needed a 3/10 macd criteria for this setup, but the 3a criteria is still a good long condition, especially when the slow line is trending so solidly up.

QCOM was an unfortunate result for me.  Entered long on the 3d condition, exited at what I thought might be a double-top (was uncertain of which way the market might turn at this point) so I exited.  I had the opportunity to get back in long, but failed to re-enter.  The Fib. levels marked here are measured off of two "seed waves", one which is highlighted on the 5-min chart, the other is indicated on the 15-min chart.

Here's a messy chart with a bunch of Fib. lines of the SPY these past two days.  The intention was to show a few things:
1- We sold off to and found support on a 50% extension confluence as measured off of the Previous Day Close (PDC) to the Open and the Previous Day High (PDH) to Low (PDL) range.
2- Price was capped to the upside with another confluence of 50% levels; 50% extensions of two momentum waves, the 50% retracement of the PDO to PDC, and the 50% retracement of the PDH to PDL.  I mention these two 50% levels because yesterday happened to be a 2x day (day's range was at least 2x greater than the previous day as explained in this document).
3- The 3/10 macd formed a V-bottom.  What I have notice about this reading is that it's best to wait until at least the Slow Line and Fast Line cross before looking to enter long.  You can visualize the macd forming a cup and handle pattern if that helps.

In comparison to the V-bottom macd pattern in AMZN today, it's just safer to look for an entry when the Fast Line and Slow Line have crossed:

Another Chart I found interesting was IWM and the number of Reverse & Regular Divergences we've seen these past two sessions.

Wednesday, April 13, 2011

tough action

 First trade was in GS and I felt it was a decent enough trade as my target was only $0.50 and the concept of momentum, pullback, continuation was legitimate enough.  The 5-min chart on the right indicates the entry and my target for half the position was vwap (not on the chart).  So, on getting my half position filled, I exited a bit below my original entry on the other half on the basis that the Open price was rejected and the sector itself was weak.

I was watching ANR and MEE as 3d-criteria setups going into the day (triggered at the close yesterday), so I was looking to buy a pullback, but instead I should have been looking to short a pullback after previous resistance was unable to hold support.  Not sure why I didn't reverse to go short on this failed long trade, as I find that if the 3d setup doesn't follow-through it's not uncommon for it to roll over and go lower (when the Fast Line & Slow Line cross on the 15-min chart).

Here was a better 3d setup that I wish I would have seen.  Much cleaner and easier to define targets as well as see price fail resistance and roll-over:

Finally, FCX was a good trade, good setup, but my position size was small.  To reiterate, the criteria I ascribe to the 3/10 macd is only a method for me to define a stage that price is in.  "4c" is a good probability bear flag, the 3/10 macd just helps to put a filter on noisy price behavior.
I made an error in labeling this chart; where it says "out" with the up arrow on the 5-min chart was for half the position, the second half was exited when price returned to the 50% extension at $52.36.

Tuesday, April 12, 2011

chopped

Not much trading done on my part today.  Stopped-out on two positions, one of which being SPY which was fine as I was just trading what I saw:
My anticipation was for a re-test of the lows (3b-to-3c-to-3d in terms of 3/10 macd criteria, which was likely my main mistake as 1's & 3's are long setups; refer to the spreadsheet if lost by this point). 


For posterity:
  Noticed two setups this morning ("noticed" as in didn't trade) based on the 3d criteria.  In AAPL below, the Slow Line turned magenta briefly (4c) but that shouldn't negate the setup (it turned 3d on the next bar) as we're looking for a strong Slow Line trend with a mild Fast Line correction into it.  I mentioned yesterday that 3d criteria fits a short squeeze or lifting of stops phenomena, so we need to be aware of the levels which would likely give us the dynamic price movement once cleared:

 Also there was NFLX.  Gaped strongly down on the open with buying that closed the first 15-min candle just above previous resistance.  Following that move was a $1 move to the next resistance level and a further $2 move to the previous day's breakdown point.

Monday, April 11, 2011

meh

Exited a short trade in CVX this afternoon, while getting lunch, rather than just keeping my stop in place.  Entered later on 4c pullack criteria for 50-cents:

The SPY demonstrated the same setup.  All I'm using the 3/10 macd for is to help me pick out price behavior; in this case a bear flag after downward momentum.

Below is a 3d setup (triggered end of day Friday) I was looking for this morning, but didn't enter.  I've mentioned before that the 3d criteria personifies a short-squeeze reaction.  This chart is a good example as price opened near resistance, filled the gap and moved beyond the sensible stop placement resistance level and continuing up to the breakdown point of the previous day:


I went long VLO on the 3d entry today (chart below) but it turned into a scratch trade.  Notice the resistance level price needed to break to induce a squeeze reaction (blue horizontal line on the 15-min chart).  Price failed to hold above the Open let alone get beyond the likely short entry stops.  When 3d setups fail it's usually a good idea to turn the other way and go short!