The setups I include on this blog are used in conjunction with the 3/10macd and the criteria I ascribe to it as a way to alert me to an existing condition of price. The key concept to take away from this blog is that I try to anticipate what will happen on the higher time frame by using a faster time frame to trigger the trade setup. I do not trade a "system" I use two indicators to clue me in to price conditions. Please read the Disclaimer located in the sidebar of this site. I can be contacted via email at toddstrade@gmail.com
I am always open to questions, comments, or suggestions on how to improve this blog.


Showing posts with label time frames. Show all posts

Tuesday, August 16, 2011

As you can gather from charts posted on this blog I use two time frames for trade considerations; one which determines a setup criteria and a faster one which triggers an entry.  Typically I use the 15- & 5-minute time frames, but I also like to gauge what higher time frames might be setting up for (see yesterday's post), especially the Daily chart.
So, here we have the SPY daily chart split with a 130 minute chart (there are 3 130-minute bars in a Daily bar, just as there are 3 5-minute bars in a 15-minute bar, preferences are your own).  The reasoning behind this is that the faster time frame can help me to enter in anticipation of what I am looking for the higher time frame to do.
For instance; in the chart below the daily (left) set up a 2b short entry back in July, but in order to anticipate this trigger you can look to the faster time frame where the histogram turning red triggered an early entry as it was hinting at price weakness (vertical red dash line on the 130-min chart).

 So, what we have in the current scenario is a pullback of the previous momentum.  Out of this pullback we typically look for (anticipate) a re-test of the lows (which can often form a momentum buy divergence).  We're essentially looking for the faster time frame to turn red, leading us into the triggered continuation move lower.
Keep in mind, this is OpEx week and just because a trade may trigger an entry doesn't mean you shouldn't be suspicious should price fail to move in your direction within a reasonable period of time.
Meanwhile, here are some that triggered at the close today, so we would be looking for a continuation move of some sort.
IYT - failed overhead gap fill looks weak, may look to re-test $79 area
SMH -trigger bar is a re-test of the bearish momentum bar that precedes it- possible move back to $28.25
XLF - Barely turned red but hasn't exactly caught a bid. 
Remember, these are triggers to setups, and anything can happen so manage your risk.  They are also based on a time frame which is more in line with holding times of longer than one day.

Thursday, July 7, 2011

higher time frame

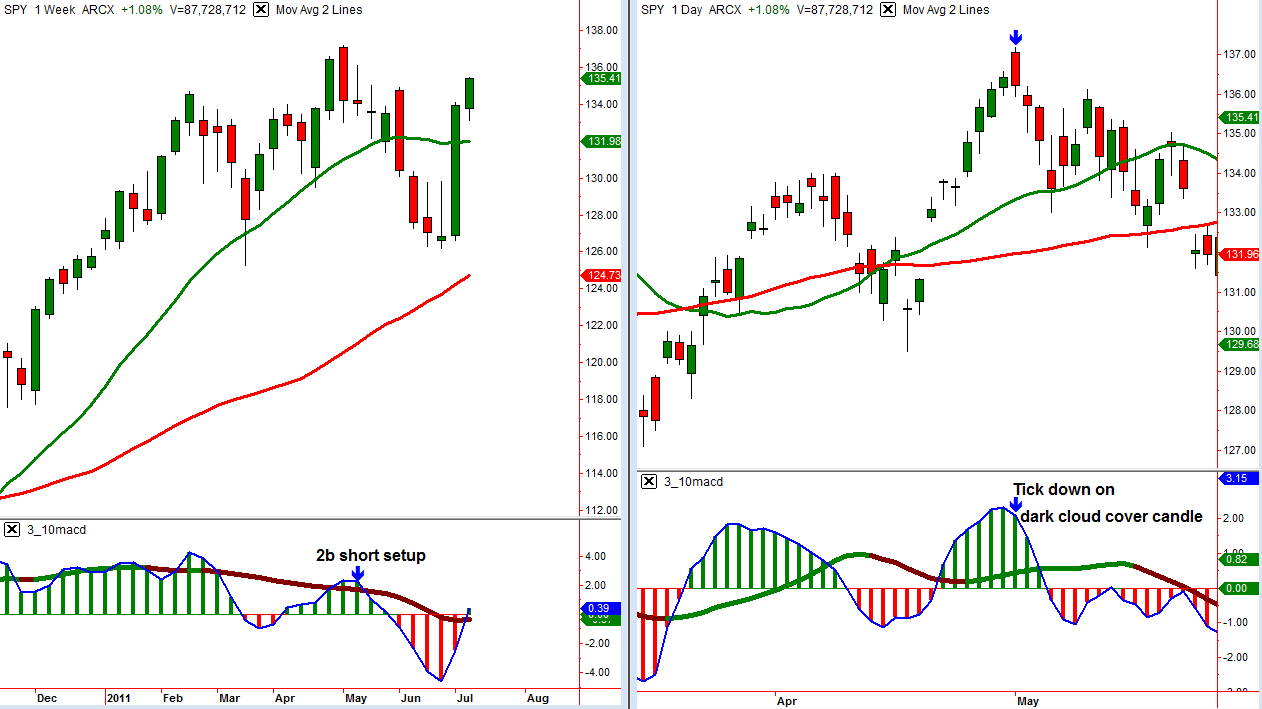
I use two time frames to trade.  One time frame which I make trading decisions off of based on anticipated setups and a faster time frame used to time entries (all covered in the document in the sidebar 3/10MACD Trading).  So, I thought I would take a look at how you may have used the weekly & daily charts to trade a longer term positions these past few months.
Coming into our recent sell-off in the SPY we had a previous swing low being tested, leading to a higher low on a lower momentum reading (reverse divergence).  This condition wasn't technically triggered until after the weekly bar's close when it was all but too late, which is why I use a faster time frame to act on the anticipation of such events (though I'll have you know I failed to anticipate this setup).
So, while the weekly chart was showing strong downside momentum all the while the previous swing low was still intact, our daily chart was showing a multi-swing divergence of its own at these lows (lower price lows on higher momentum lows). 

Take a closer look at the daily chart and what price and momentum were telling us.
 All very easy in hindsight, but a very mechanical approach is what allows one to ignore news/message boards, etc.
 
Now take a look at some previous swing type setups that occurred over these past few months.  Using the weekly chart to alert you to a criteria and the daily chart to time an entry.
 
2b short setup (what's a "2b setup"?) on the weekly (left), timed entry on the daily (right) chart

and my favorite, 3d setup on the weekly going back to March '09 and the timed entry on the daily

Thursday, October 29, 2009

October

Interestingly:
The month of October's two pivots (being that price "bounced" off these levels) were the previous month's Open and, more recently, the previous month's closing price. Observe: