The setups I include on this blog are used in conjunction with the 3/10macd and the criteria I ascribe to it as a way to alert me to an existing condition of price. The key concept to take away from this blog is that I try to anticipate what will happen on the higher time frame by using a faster time frame to trigger the trade setup. I do not trade a "system" I use two indicators to clue me in to price conditions. Please read the Disclaimer located in the sidebar of this site. I can be contacted via email at toddstrade@gmail.com
I am always open to questions, comments, or suggestions on how to improve this blog.


Thursday, February 28, 2013

Thu. 02_28

today's trade

3-point drop in the last minute of trading.  Looks as though March may have an interesting start tomorrow.
Unfortunately didn't take the short into the end of day.....so dumb

Looking like a lower high, followed by a double-top at resistance.  Today amounted to a faded breakout.
Higher time frame (65m) still showing a bearish favored trend, the 3/10macd slow/fast line is crossed and I'd like to see an XYZ wave on the faster (15m) time frame to short but I would still suspect a higher low to be defended.  $150.80 = 50% retrace of this past move.

Wednesday, February 27, 2013

Wed. 2_27

today's trade
A key for the above chart to define the horizontal lines and dots.  For further explanation, see this link:  

Criteria 1b-1a throughout the day which means trades which anticipate a breakout and or base break.

The red diagonal line in the 15m chart above represents the cycle price and time projection I drew before the market opened this morning based on the symmetry of the cycles shown below:
The fuchsia line in the chart above reflects the cyclic trend line (a la Stevenson PTT) where a close through that line would indicate the beginning of the next regular cycle.  A partial decline followed by a return to the $152.25 area would be pretty bullish.  
The sketchiest thing at this point is the lower high scenario indicated on the 65m (also a reverse divergence currently) with the 15m showing a 2b criteria (Head & Shoulders pattern on the 15m 3/10macd).  

Also should point out a potential reverse divergence between the S&P price vs. S&P breadth.
S&P Advancing/Declining (left) and S&P Up/Down volume (right)

Tuesday, February 26, 2013

Tue/ 2_26

today's trade
A key for the above chart to define the horizontal lines and dots.  For further explanation, see this link:  


Monday, February 25, 2013

Mon. 02_25

today's trade
A key for the above chart to define the horizontal lines and dots.  For further explanation, see this link:  

Not very subtle. Bears owned the day.
Volume was huge, range was huge, $147 seems like a logical place to find some support for now.

Saturday, February 23, 2013

Gold lower

Not looking good for Gold.  I had hope for it a few weeks ago, but sell stops were unwound.
My premise a while ago was that it could be forming a cup w/ handle pattern, but since that posting, the handle (channel) broke down further.

The daily (above, right) looks a bit oversold at this point, so I can see a pullback higher to try and regain the weekly (above, left) lower channel.  If buyers are attracted then I can see a buy divergence on the weekly playing out, but the ball is obviously in the bear court.

Looking at the monthly (below, left) I can imagine that if 1529 gives then I think it can get messy.

Just for kicks, below is the weekly cycle count, since it has been consolidating for 77-weeks (I believe).  Previously, it spent 100-weeks in a bullish frenzy after a consolidative breakout.  So, it seems about right that it is consolidating as much as it has been in order to give symmetry to the previous bullish momentum.
The red line represents the price and time target based on the previous Inverted Cycle.  The fuchsia line is the cyclic trend line (CTL in the Stevenson PTT concept) which is the trendline needed to be broken in order to consider the current Regular Cycle ended and the next inverted cycle to begin.


Friday, February 22, 2013

updated

An update of a previous post here
3d criteria setup on the weekly U.S.Dollar Index.  Looks like it still has some gas left in the tank

Fri. 02_22

today's trade
A key for the above chart to define the horizontal lines and dots.  For further explanation, see this link:  
First long and short nearly evened themselves out, trying to get a feel for which way the market wanted to go.
Third trade, long, was the anticipation of the 15m 3/10macd going back to 1a (from 1b).
Fourth trade, short, was anticipating the 2c on 15m 3/10macd but you don't really know how much of a pullback you'll get.  The 5m had a tweezer top, an "M" top, overhead supply from the previous day's selling (bearish "trend") AND STILL price would't give up the IB_High (which was a confluence of the o/s_high and o/n_high areas.  Took a small loss.
Fifth trade, long, anticipating the 2c-2d criteria setup to play out,  I got out for scraps and walked away from the computer.  F@(%!


Higher time frame...no pullback, V-bottom so far.  Maybe it was a Bull trap if the recent news (Moody's GB downgrade) has any effect

Otherwise, there's this similarity that can play out:
242-days ago something very similar happened in the SPY that happened today.

Thursday, February 21, 2013

just a chart

Weekly/Daily of the SPY.  Maybe the healthiest thing for this market is to correct over the next 4-months.  The buying and selling cycles on the higher time frame weekly have been pretty symmetrical.

Thu. 2_21

today's trade
A key for the above chart to define the horizontal lines and dots.  For further explanation, see this link:  

4c to start the day - trading a breakdown
Small continuation move later in the day holding the IB_low (4d-4c/3c)
3d criteria short covering rally into the 1:30 hour

Looking for the 15m 3/10macd to either set up a 1b-1a breakout higher or a 2c or 4c) breakdown on the short side

This is the first time the Daily (below, right) 3/10macd has had a negative fast line.  Still have to treat this Daily as a 2c-2d criteria setup, where we would be looking for the faster time frame (65m below, left) to set up a 3-push pattern, or inverse H&S and where the 3/10macd would preferably see the 3d criteria set up (unless it is a V-recovery in which case we would get the 65m 3/10macd going to 3a to 1a).  Worth noting, that 65min made a higher pivot low on strong downside momentum (reverse divergence) 

Wednesday, February 20, 2013

Wed. 02_20

today's trade
A key for the above chart to define the horizontal lines and dots.  For further explanation, see this link:  

Left a lot on the table today :/
Price held a 50% retrace (Fri. lows to yesterday's high) up until FOMC minutes came out.  Very weak attempt to rally which seems unusual for the post-FOMC fade move (just a validation of the strong selling on the tape).  

 There wasn't much to go on in terms of 3/10macd.  Price was stretched obviously (all year basically) and we just kept cycling higher.  The higher time frame became cautious with a fast line/slow line cross (vertical dash line and shaded rectangle).  This coincided with the completion of a small XYZ corrective wave on the faster time frame.  At this point it was a matter of, do we just bounce and continue higher (as we have all year) or do we have a steeper correction?  The faster time frame ended up forming a larger XYZ corrective wave.
During the FOMC minutes time frame the 15-min 3/10macd was showing potential 3d criteria setup.  When the 3d fails it has potential for a rollover move such as this one, which ends up turning the 3/10macd citeria from 3d into 4c continuation.


Tuesday, February 19, 2013

Tue. 02_19

today's trade

A key for the above chart to define the horizontal lines and dots.  For further explanation, see this link:  

Having a hard time holding and adding

Nothing's changed, we move up, we cosolidate, we move up

Friday, February 15, 2013

failed

I've been stalking AAPL on the long side for the most of the week.  While I've been stalking AAPL this week, I noticed how "easy" the short side has been.  "Easy" in the sense that resistance levels were sold without much re-testing, resistance levels held and prices went lower.  However, I was looking for long entries.  My premise being that the higher time frame was setting up a 3-push 3d crtieria setup, as seen in the chart below.
So, in the charts above;  The 65m chart (left) I was looking at the 3-push price pattern with the 3d criteria.  On the right is the past 3, 15m intraday sessions, with entry points I was watching (though one of which is not indicated, the 3rd up arrow on the 15m 3/10macd isn't indicated on the price chart; user error).  The 2 down arrows were potential short entries based on the 65m 3/10macd "failing" the 3d criteria setup (essentially price rolling over and not squeezing higher the way I was anticipating).

I've written throughout this blog about the 3d criteria setup.  I'm looking for a 3-push price pattern or something similar to an inverse Head & Shoulders.  The faster time frame entry is an "a" criteria (3a or 1a) on the 3/10macd.
I've also mentioned that if this setup "fails" there may exist opportunity to turn around and short the market.  This is where I "failed" by not taking the short side of this trade, even though I was witnessing signs of selling in the tape all week.

The chart below is the 15m/5m from Thursday where I was looking to buy into this higher time frame setup.  I took the first up-arrow entry on the 5m (other 2 were equally likely entries).  I exited with a gain.


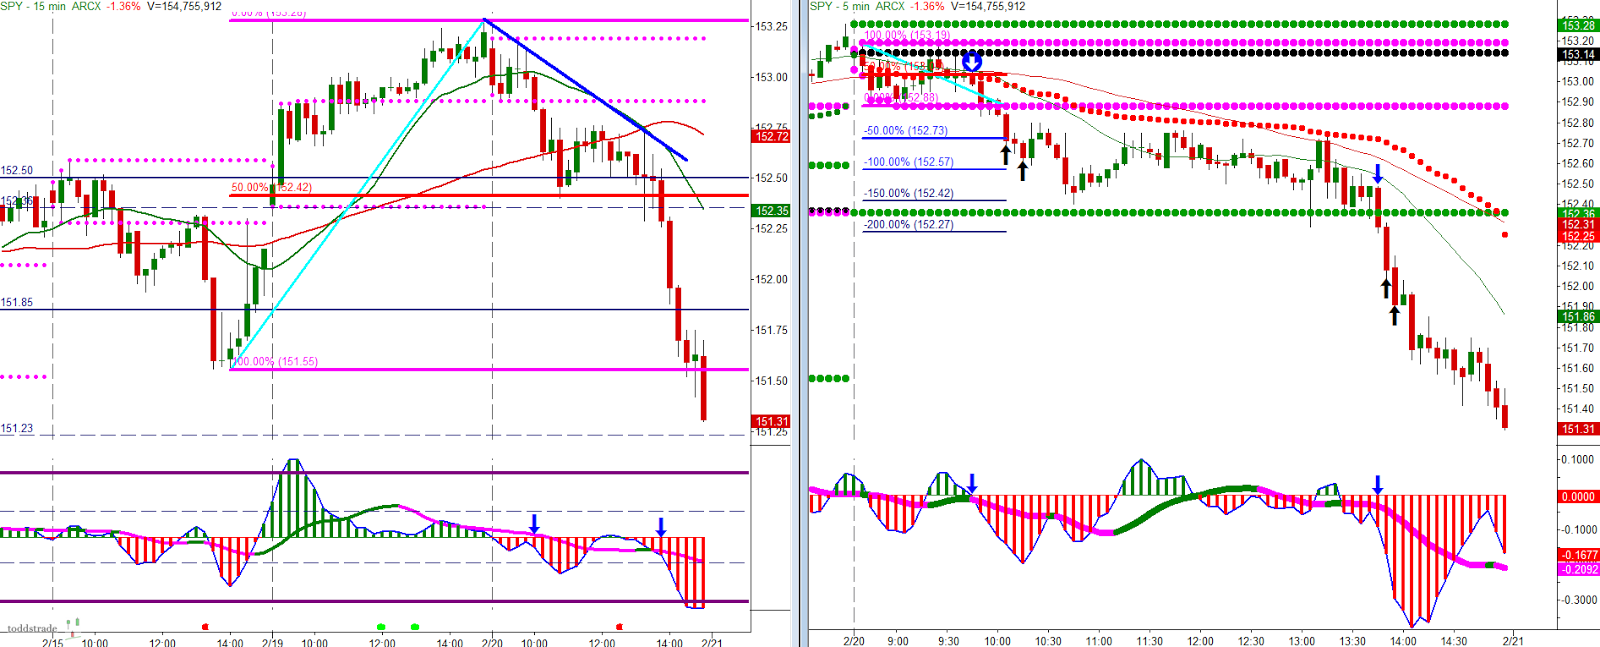
 The chart below is the 15m/5m from today where I was looking to buy into this, still valid, higher time frame setup.

I entered long and exited with a small loss.  And then I failed.  I failed to take advantage of the short opportunities that presented themselves as well as failing to take advantage of the heavy selling I witnessed all week on the tape.   It is what it is.

Thursday, February 14, 2013

Thu. 02_14

today's trade
A key for the above chart to define the horizontal lines and dots.  For further explanation, see this link:  

I'm going to start adding up/down arrows to the 15m in order to reference the setup I'm anticipating on this time frame. 3d criteria at the open.  Instead of adding in the late afternoon I (foolishly?) I was in and out.  Breadth was relatively neutral and OpEx week are my excuses.  Price nailed the 50% Fib projection on the open, a target I was looking (hoping) for in yesterday's short setup :/

As I've mentioned; with 2c-2d I'm looking for 3d criteria on the faster time frame (15m in the charts below) which is what we saw this morning.  The weak open was pretty surprising to me and the price development throughout the day looks a lot like short covering, but looks like it can easily roll over.  The higher time frame (65m) has a slow line that's getting very close to zero, so anticipating this I would be looking for a 2c OR fast line pullback into the down sloping slow line on the 15m 3/10macd (which would read something like 2c to 2(or 4)d to 4c to 4d continuation as the diagram below depicts).
However, a slow line crossing zero often precedes the 20- & 50-MA's to cross.  This can only happen at the very least if price works inside the 20- & 50-MA window.  Otherwise, the Moving Averages have a strong bullish arrangement and will take a lot of bearish momentum to change that in the near term.  So,  we need to see price working at least under $151.75s.   Also keeping in mind that the SPY can correct 1.2% and we would only be at the 20-day Moving Average, something not tested yet this year.

Wed. 2_13

This didn't post yesterday evening, so...

today's trade
A key for the above chart to define the horizontal lines and dots.  For further explanation, see this link:  


Fairly frustrating day.  Didn't take any trades until 1pm.  As it would turn out, frustration can be patience in disguise.  


The higher time frame (65m) looks like it may be setting up to go higher?  Provided we get above/hold $152.25 we may get another impulse move higher.  This would "re-set" the faster time frame (15m) 3/10 macd back to a bullish bias (3a to 1a).  Essentially we would be anticipating the 65m fast line to turn green and to trade that anticipation we would be looking for the 15m to turn 3a OR a pullback of the fast line into the positive sloping slow line (so it would be something like 3a to 1a to 1b and back to 1a).
Look at how ridiculous the $151.75 support held, it's the definition of "underlying bid".  Two days left in Options Expiration week, it can always get freaky.