


Left a lot on the table today :/
Price held a 50% retrace (Fri. lows to yesterday's high) up until FOMC minutes came out. Very weak attempt to rally which seems unusual for the post-FOMC fade move (just a validation of the strong selling on the tape).
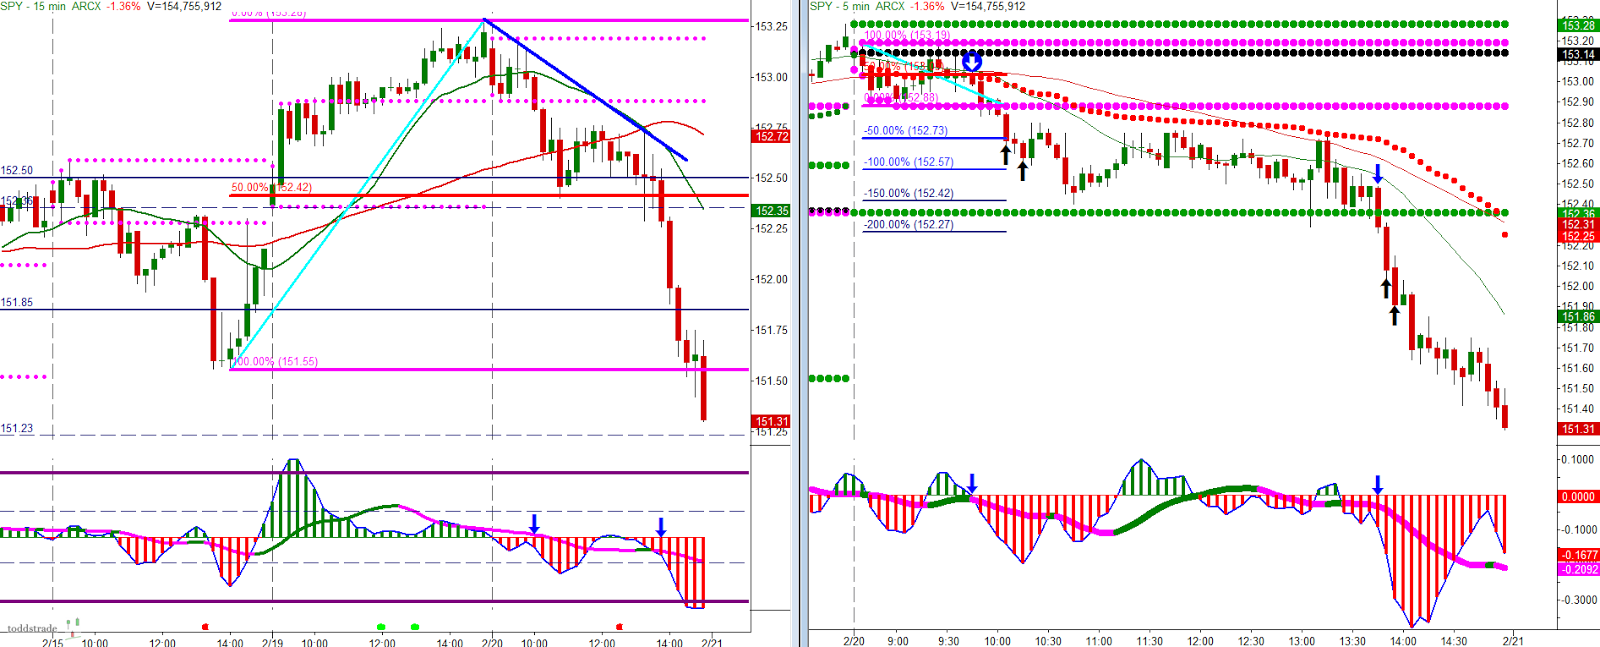
There wasn't much to go on in terms of 3/10macd. Price was stretched obviously (all year basically) and we just kept cycling higher. The higher time frame became cautious with a fast line/slow line cross (vertical dash line and shaded rectangle). This coincided with the completion of a small XYZ corrective wave on the faster time frame. At this point it was a matter of, do we just bounce and continue higher (as we have all year) or do we have a steeper correction? The faster time frame ended up forming a larger XYZ corrective wave.
During the FOMC minutes time frame the 15-min 3/10macd was showing potential 3d criteria setup. When the 3d fails it has potential for a rollover move such as this one, which ends up turning the 3/10macd citeria from 3d into 4c continuation.

No comments:
Post a Comment