A key for the above chart to define the horizontal lines and dots. For further explanation, see this link:
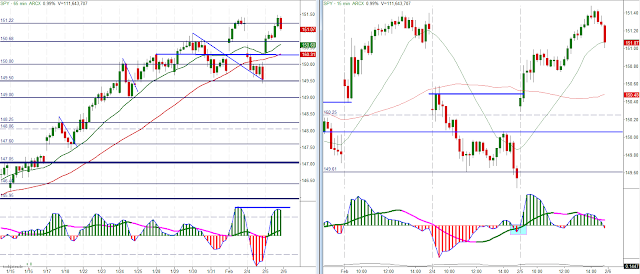
Started off the day with a 3d criteria setup. Middle of the day was a 2c-2d criteria setup, and finished the day with a 2b criteria short setup. Slightly higher high today, but a double-top until proven otherwise.
It looks as though it's just a matter of gauging the next pullback. 15-min is in 2c-2d criteria so the current pullback should be supported. It's the pullback higher (the bounce we can expect from today's late day selling) that will be more telling. So, I'd be looking to short some sort of XYZ corrective wave on the 15-min, otherwise buy in anticipation of the fast line going green again.
With the symmetrical cycle price pattern taking shape, the Daily chart (below, right) looks like it's putting in a 3-push pattern)
Lastly, today saw the highest ADV./DECL. Volume since this year's rally began. Which happened to follow the largest NEGATIVE ADV/DECL reading since this rally began. Seems to smell of distribution perhaps.


No comments:
Post a Comment