The week ending 11/05 the SPY printed a large momentum bar (teal candle).
Here is how the mipoint (blue horizontal line) acted as a pivot for the following 8-days where 100% of the momentum impulse has been retraced.
Also on the chart below (green horizontal) is the midpoint (as measured from the Close on 11/03 to the Open of 11/04) of the impulse gap up. Support becomes Resistance:
The setups I include on this blog are used in conjunction with the 3/10macd and the criteria I ascribe to it as a way to alert me to an existing condition of price. The key concept to take away from this blog is that I try to anticipate what will happen on the higher time frame by using a faster time frame to trigger the trade setup. I do not trade a "system" I use two indicators to clue me in to price conditions. Please read the Disclaimer located in the sidebar of this site. I can be contacted via email at toddstrade@gmail.com
I am always open to questions, comments, or suggestions on how to improve this blog.
Showing posts with label pivots. Show all posts
Wednesday, November 17, 2010
Sunday, June 27, 2010
FXE base
After recovering from all the hype in the early part of this month, the Euro currency has come back to a previously accepted value range.
Looking at this weekly chart of FXE, the measured move jumps out at you:
There are a couple of Resistance zones overhead, but price looks more interested to test what's above than what's below at this point in time.
$125 will be a big pivot to clear. If it can recover $125 support than there's a lot of clear air between that and $135 to test.
Looking at this weekly chart of FXE, the measured move jumps out at you:

There are a couple of Resistance zones overhead, but price looks more interested to test what's above than what's below at this point in time.
$125 will be a big pivot to clear. If it can recover $125 support than there's a lot of clear air between that and $135 to test.
Monday, November 16, 2009
RIMM
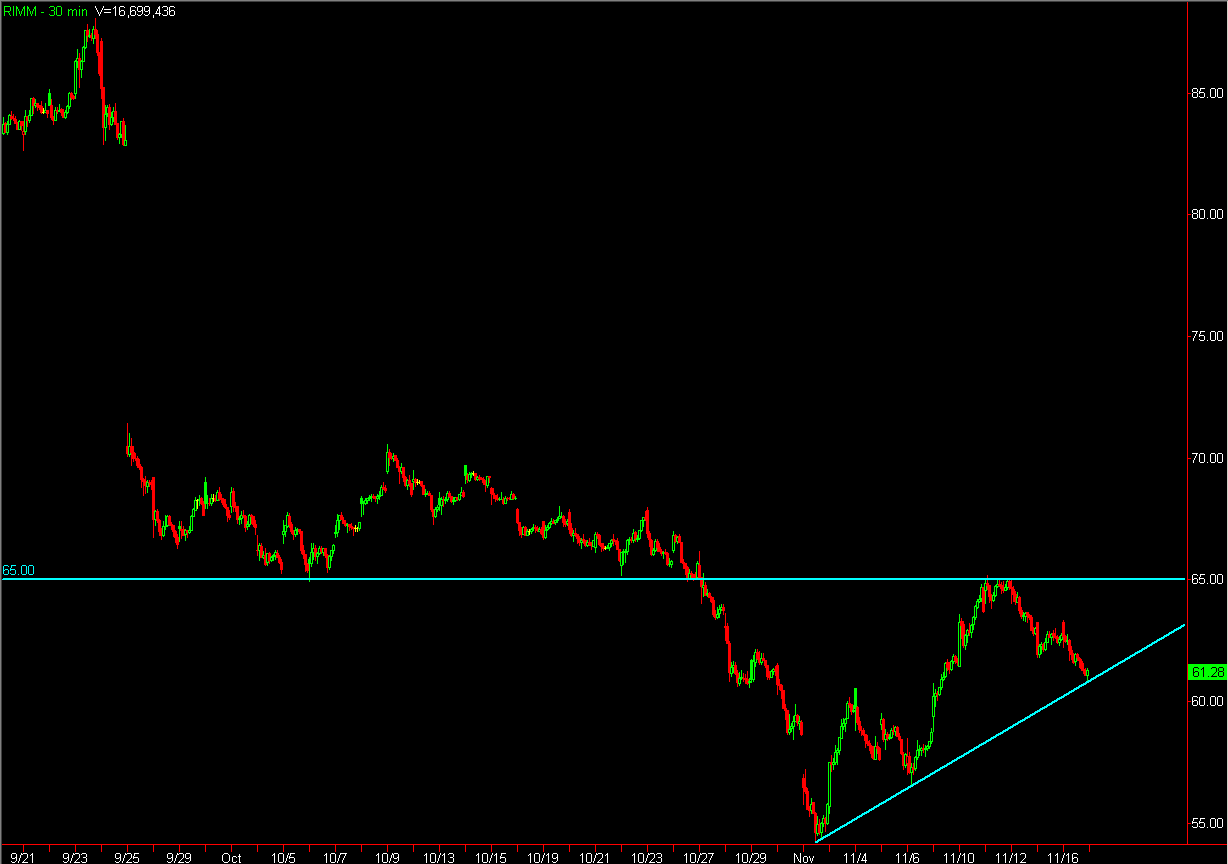
RIMM formed a pivot resistance level at $65 recently and sits at a level which could loan it support from here.
It was supported today at a trendline extension which happened to be right on top of a 38% retracement level (drawn coming off of the lows and into the $65 pivot) and of course a momentum divergence.
And to top it all off, it looks as though it could be setting up for a 5th Wave!
It was supported today at a trendline extension which happened to be right on top of a 38% retracement level (drawn coming off of the lows and into the $65 pivot) and of course a momentum divergence.
And to top it all off, it looks as though it could be setting up for a 5th Wave!
Thursday, October 29, 2009
October
Thursday, October 8, 2009
squeeze em again
The markets put in another squeeze today, it's the same rinse and repeat cycle; figure out where the majority of stops are set, gap the market into that level, hit the stops and scare the bears into covering their shorts yet again.
At any rate, there were a lot of decent break-out (short-squeeze) moves today, but the barometer of this market (GS) saw consistent selling. This bellewether of ours ended the day printing a dark-cloud cover candle pattern on a momentum sell divergence.
The SPY gaped up this morning and bounced off of my resistance pivot (coinciding with the morning's Open) all day long.
Check out the TICK divergences intra-day. I'm now using Richard Todd's "TICK Molestor," check it out here.
Today on the SPY showed a momentum sell divergence that ended up rolling over
While the Daily is also showing waning momentum while price pushes up on vapors.
At any rate, there were a lot of decent break-out (short-squeeze) moves today, but the barometer of this market (GS) saw consistent selling. This bellewether of ours ended the day printing a dark-cloud cover candle pattern on a momentum sell divergence.
The SPY gaped up this morning and bounced off of my resistance pivot (coinciding with the morning's Open) all day long.
Check out the TICK divergences intra-day. I'm now using Richard Todd's "TICK Molestor," check it out here.
Today on the SPY showed a momentum sell divergence that ended up rolling over
While the Daily is also showing waning momentum while price pushes up on vapors.
Friday, October 2, 2009
Fri. 10_02
A big gap down on the SPY this morning that had a number of reasons to look to buy the open.
(a) The gap from the previous day's close to the open was just about 1%, quite a large deviation that should tell you to pay attention to the lows and how they're being tested.
(b) Price gaped down right on top of the 50-EMA on the daily chart
(c) the gap also coincided with a number everyone was looking at for support, $102
(c) the momentum divergence on the 30-min chart that I mentioned yesterday.
Take a look:

Other than that, price just chopped around my support pivot all day long.
A curious observation about today is that the TICK had a lot of large positive readings, not sure what that's saying about the market breadth.
After all is said and done we closed the day up, on top of the 50EMA as a gap-down (but filled) inverted hammer. While the weekly chart doesn't look overly bearish, yet. The 20-ema has just caught up with the 50-ema and price sits right on top of a 38% retracement from the highs of '07 to the lows of March.
(a) The gap from the previous day's close to the open was just about 1%, quite a large deviation that should tell you to pay attention to the lows and how they're being tested.
(b) Price gaped down right on top of the 50-EMA on the daily chart
(c) the gap also coincided with a number everyone was looking at for support, $102
(c) the momentum divergence on the 30-min chart that I mentioned yesterday.
Take a look:

Other than that, price just chopped around my support pivot all day long.
A curious observation about today is that the TICK had a lot of large positive readings, not sure what that's saying about the market breadth.
After all is said and done we closed the day up, on top of the 50EMA as a gap-down (but filled) inverted hammer. While the weekly chart doesn't look overly bearish, yet. The 20-ema has just caught up with the 50-ema and price sits right on top of a 38% retracement from the highs of '07 to the lows of March.
Thursday, October 1, 2009
next stop 50EMA
Watch to see if we get a bounce at the 50EMA on the SPY ($102).
Another trend day down today. Market breadth was bearish the entire day, yet there were times I found myself fighting the trend.
The first 30-minutes of the morning SPY based at my support pivot before failing. That big freakish candle at 10:01a.m. was ominous indeed.
Watch the first hour tomorrow morning to see if any buying is triggered. Check to see if the 30-min SPY chart puts in a momentum buy divergence.
Watch for a potential test of $104 tomorrow as that is within today's value area ($103.50-$104.00) and is also the last hour's high (day after a trend day down look at the last hour's high as good resistance).
Another trend day down today. Market breadth was bearish the entire day, yet there were times I found myself fighting the trend.The first 30-minutes of the morning SPY based at my support pivot before failing. That big freakish candle at 10:01a.m. was ominous indeed.
Watch the first hour tomorrow morning to see if any buying is triggered. Check to see if the 30-min SPY chart puts in a momentum buy divergence.
Watch for a potential test of $104 tomorrow as that is within today's value area ($103.50-$104.00) and is also the last hour's high (day after a trend day down look at the last hour's high as good resistance).
Friday, September 25, 2009
Fri. 9/25
We ended the week with an inside and down candle and we sit on a short-term trend-line support.
With a trend-day down yesterday, we needed to keep a watch on how price reacts to both the previous day's low (PDL), the open, and the high's of the last hour of trading (LHH).
We could have anticipated a choppy beginning so it's important not to have any knee-jerk reactions. Our gap down sold right into the PDL on mediocre TICK. We snapped back up until price began to test the last hour's highs on fading TICK, bringing price lower.
The low of the day registered a momentum buy divergence, eventually closing right on top of my support pivot.
With a trend-day down yesterday, we needed to keep a watch on how price reacts to both the previous day's low (PDL), the open, and the high's of the last hour of trading (LHH).
We could have anticipated a choppy beginning so it's important not to have any knee-jerk reactions. Our gap down sold right into the PDL on mediocre TICK. We snapped back up until price began to test the last hour's highs on fading TICK, bringing price lower.
The low of the day registered a momentum buy divergence, eventually closing right on top of my support pivot.
Thursday, September 24, 2009
trend day down
finally!
Nothing to get too excited over, just biding time until we get a dip far enough to interest buyers.
Today's sell-off extended to the lows reached on Sept. 14. which coincided with a 38% Fib. retracement from the lows of Sept. 3rd to the highs of Sept. 17th.
We gaped up slightly, consolidated, returned to the previous day's close (scalp short entry!) where the selling ensued. Notice how price consolidates for the first 35-minutes, but once the pile has been stacked price just slices through the previous day's low/close decisively.
A Fib. extension snapped between my S/R pivots gave a good general level of expected exhaustion today.
Remember what to look for to expect a trend day.
Here's a chart of the day and a lesson in when to recognize a short covering squeeze.
Nothing to get too excited over, just biding time until we get a dip far enough to interest buyers.
Today's sell-off extended to the lows reached on Sept. 14. which coincided with a 38% Fib. retracement from the lows of Sept. 3rd to the highs of Sept. 17th.
We gaped up slightly, consolidated, returned to the previous day's close (scalp short entry!) where the selling ensued. Notice how price consolidates for the first 35-minutes, but once the pile has been stacked price just slices through the previous day's low/close decisively.
A Fib. extension snapped between my S/R pivots gave a good general level of expected exhaustion today.
Remember what to look for to expect a trend day.Here's a chart of the day and a lesson in when to recognize a short covering squeeze.
Tuesday, September 22, 2009
From now on...
...when price gaps above my daily Resistance pivot (or below my daily Support pivot) I'm going to snap Fib. lines between the two pivots to get my extension S/R. Seems to work well.
Here was today's activity in FCX and POT, both of which gaped above their respective Resistance pivots, so I snapped a Fib. line between the two. The extensions gave excellent target potential.

Here was today's activity in FCX and POT, both of which gaped above their respective Resistance pivots, so I snapped a Fib. line between the two. The extensions gave excellent target potential.

Monday, September 21, 2009
Monday chop
A choppy day for the SPY. With such a sizable gap down it was curious that we didn't get any strong "buy the dip" hands coming in at the lows , but today's volume was pathetic.
SPY basically chopped around my Support pivot all day long. When we finally did close the gap a TICK divergence hinted at possible selling.
SPY always gets choppy when these moving averages cross over.
Still going to watch the setups I listed over the weekend. LZ $72 may be a mover.
SPY basically chopped around my Support pivot all day long. When we finally did close the gap a TICK divergence hinted at possible selling.

SPY always gets choppy when these moving averages cross over.
Still going to watch the setups I listed over the weekend. LZ $72 may be a mover.
Friday, September 18, 2009
Fri. OPEX
Glad this week is over, now we can see some movement next week in whatever direction we take. Despite being a quadruple witching day we did see some textbook patterns show up.
After the initial selling we got a big green bar followed by successive coiling that ended in a measured move down.
After the completion of a measured move (which happened to coincide with the 50-EMA on our 30-min chart!!) we had a buy divergence that came with a big rush of volume (buy the dip!). Today my support pivot acted as resistance (I love these pivots!).
Here's how I marked up my 1-min chart today with the NYSE TICK in the sub-chart.
I suspect this overhead gap on the SPY is going to be shorted pretty heavily.

I had a decent day with FCX today (short and long). I also keep S/R pivots for this issue; the support level acted as resistance perfectly. You have to train yourself to buy that momentum divergence whenever you see it.
After the initial selling we got a big green bar followed by successive coiling that ended in a measured move down.
After the completion of a measured move (which happened to coincide with the 50-EMA on our 30-min chart!!) we had a buy divergence that came with a big rush of volume (buy the dip!). Today my support pivot acted as resistance (I love these pivots!).

Here's how I marked up my 1-min chart today with the NYSE TICK in the sub-chart.
I suspect this overhead gap on the SPY is going to be shorted pretty heavily.
I had a decent day with FCX today (short and long). I also keep S/R pivots for this issue; the support level acted as resistance perfectly. You have to train yourself to buy that momentum divergence whenever you see it.
Thursday, September 17, 2009
OPEX Thursday
Today's selling got me excited for an intermediate "top", but we need more proof of a turn in sentiment.
We have seen an increase in volume this week and we're sitting right at a gap fill that couldn't get more technically significant.
A closer view of the SPY daily; Wouldn't you just love to see a spike and fail into $110?
I've mentioned before that I check the first half hour of Total NYSE shares (symbol is $TVOL on Tradestation) to get keyed in to whether larger time frame players may be participating. Here's what today looked like; almost as big as yesterday. Notice the largest spike in $TVOL occurred on Sept. 2, the bottom of the most recent swing low!
Upward momentum continues to wane. Here's the 60-min SPY (notice the "Slingshot" setup on 9/2, where momentum made a lower low while price made a higher low).
Here's how the 30-min is setting up. It looks like a Head & Shoulders pattern, but we've seen this too many times before, we just have to wait to see if we test the 50-EMA and how it reacts on such a test.
Here's the intra-day SPY. Things to point out: My resistance pivot held twice, (2) a little inverted H& S pattern, and (3) a H&S pattern on the macd late in the day. Not highlighted on the chart we also saw a 3-push move to the downside. The first "impulse" move occurred with the break through of the lower keltner channel. We retraced and then a second and third impulse move formed our buy divergence in the 3/10 macd.

Let's check out the NYSE TICK in combination with the SPY on a 1-min. timeframe.
Things to look for are divergences between highs/lows in price and/or TICK which are marked on the chart above. As an aside, we did have a successful buy scalp setup that I have mentioned before.
I also keep an eye out to see if the other TICKs (Nasdaq, and Russell) confirm what's happening on the NYSE TICK. It's a matter of confirmation/non-confirmation and whether we may be in counter-trend, trend, or trend reversal move.
We have seen an increase in volume this week and we're sitting right at a gap fill that couldn't get more technically significant.
A closer view of the SPY daily; Wouldn't you just love to see a spike and fail into $110?
I've mentioned before that I check the first half hour of Total NYSE shares (symbol is $TVOL on Tradestation) to get keyed in to whether larger time frame players may be participating. Here's what today looked like; almost as big as yesterday. Notice the largest spike in $TVOL occurred on Sept. 2, the bottom of the most recent swing low!
Upward momentum continues to wane. Here's the 60-min SPY (notice the "Slingshot" setup on 9/2, where momentum made a lower low while price made a higher low).
Here's how the 30-min is setting up. It looks like a Head & Shoulders pattern, but we've seen this too many times before, we just have to wait to see if we test the 50-EMA and how it reacts on such a test.
Here's the intra-day SPY. Things to point out: My resistance pivot held twice, (2) a little inverted H& S pattern, and (3) a H&S pattern on the macd late in the day. Not highlighted on the chart we also saw a 3-push move to the downside. The first "impulse" move occurred with the break through of the lower keltner channel. We retraced and then a second and third impulse move formed our buy divergence in the 3/10 macd.
Let's check out the NYSE TICK in combination with the SPY on a 1-min. timeframe.
Things to look for are divergences between highs/lows in price and/or TICK which are marked on the chart above. As an aside, we did have a successful buy scalp setup that I have mentioned before.I also keep an eye out to see if the other TICKs (Nasdaq, and Russell) confirm what's happening on the NYSE TICK. It's a matter of confirmation/non-confirmation and whether we may be in counter-trend, trend, or trend reversal move.
Subscribe to:
Posts (Atom)