

Tuesday, June 29, 2010
Q gartley
{updated} June 29
I can't believe it, but it actually reached it's target
{updated} June 25
As good as it may look, I have my doubts this will reach it's target. Though it could just take its time getting there.
{updated} june 24
Looking at the bearish Gartley on the QQQQ June 21 updated June 22
I can't believe it, but it actually reached it's target

{updated} June 25
As good as it may look, I have my doubts this will reach it's target. Though it could just take its time getting there.

{updated} june 24

Looking at the bearish Gartley on the QQQQ June 21
 updated June 22
Monday, June 28, 2010
just sayin
AMZN...a lot of clear air below. Consumer Confidence numbers come out tomorrow...just sayin'.


TLT and SPY
TLT closed on $100 today (highest close since April 2009).
A look at TLT vs. SPY (bottom chart). The last time this correlation crossed over was July 15, 2009 (crazy if it crosses the other way a year to the day!). A few days after this cross we got a breakout and higher highs on the S&P500:

The SPY closed right on its Lower Median Line: Wednesday is the last day of the month, how will that effect the markets until then?
A look at TLT vs. SPY (bottom chart).
 The last time this correlation crossed over was July 15, 2009 (crazy if it crosses the other way a year to the day!). A few days after this cross we got a breakout and higher highs on the S&P500:
The SPY closed right on its Lower Median Line:
 Wednesday is the last day of the month, how will that effect the markets until then?
Sunday, June 27, 2010
FXE base
After recovering from all the hype in the early part of this month, the Euro currency has come back to a previously accepted value range.
Looking at this weekly chart of FXE, the measured move jumps out at you:
 There are a couple of Resistance zones overhead, but price looks more interested to test what's above than what's below at this point in time.
 $125 will be a big pivot to clear. If it can recover $125 support than there's a lot of clear air between that and $135 to test.
Looking at this weekly chart of FXE, the measured move jumps out at you:

 There are a couple of Resistance zones overhead, but price looks more interested to test what's above than what's below at this point in time.
 $125 will be a big pivot to clear. If it can recover $125 support than there's a lot of clear air between that and $135 to test.
Saturday, June 26, 2010
SPY cycle update
Some more updates on the Stevenson Cycles in the SPY, with a few different scenarios;
Here we have a broad, generalized look at the larger cycles at play: A little more complicated version I came up with, which illustrates how after a big full cycle completes (the IC trend up from Feb. through April and the "flash crash" scenario that played out to complete the IC/RC phase) one can expect a RC/IC consolidation phase that forms a range with cycles of lesser amplitude. It is also helpful in how it can highlight when price is "coiling" as it did in the most recent phase:
 Here's an alternative which shows a little less noise than the one above:
 And here is one showing where the complimentary cycle targets where (solid red lines). The targets weren't met until price started to stabilize after the large momentum thrust:

I haven't done a post regarding the Stevenson PTT in a long time, but that doesn't mean I don't pay attention to the cycles playing out.
Going back to the beginning of the year on SPY, we saw the Inverted cycle complete, while the Regular Cycle target was met early (sign of weakness).
Next we have the "flash crash" selloff that completed our Regular Cycle (RC) leading to our next Inverted Cycle (IC) which is now down. We have two Cycle targets that are still valid: - We could just start rallying like crazy to go back to April highs, thereby completing an IC that would be just as wide as our previous Regular Cycle that stretched from Feb. to June.
- The bottom could fall out, confirming a close of our Down IC and giving us an extended Regular Cycle down.Price still seems to be recovering from the flash crash supply dump, and though be it wide, price is range-bound. Recently, we've seen some volatile supply/demand imbalance, which shows itself in wide, steep, and rounded cycles close together, like so: The previous Regular and Inverted Cycle targets were met on time (as they often do when you see such symmetry), while the most recent cycle, should complete (and start the next Inverted Cycle) with a close above Thursday's high.Whatever is going to happen it should be a big, strong move as these wide, steep, and rounded cycles close together often precede such moves.We saw this on a smaller scale back in April:
 I also happen to have a screen shot of an intra-day chart that set up this past week in MON:
 This behavior isn't subtle either. The price moves preceding it (in this case, a trend down with relatively average range bars) appear as orderly and typical of the observable environment. Then you get this order flow that is out of the ordinary compared to what came before it, obviously sucking in some positions that needed to cover (bringing fuel to the fire).
Here we have a broad, generalized look at the larger cycles at play:
 A little more complicated version I came up with, which illustrates how after a big full cycle completes (the IC trend up from Feb. through April and the "flash crash" scenario that played out to complete the IC/RC phase) one can expect a RC/IC consolidation phase that forms a range with cycles of lesser amplitude. It is also helpful in how it can highlight when price is "coiling" as it did in the most recent phase:
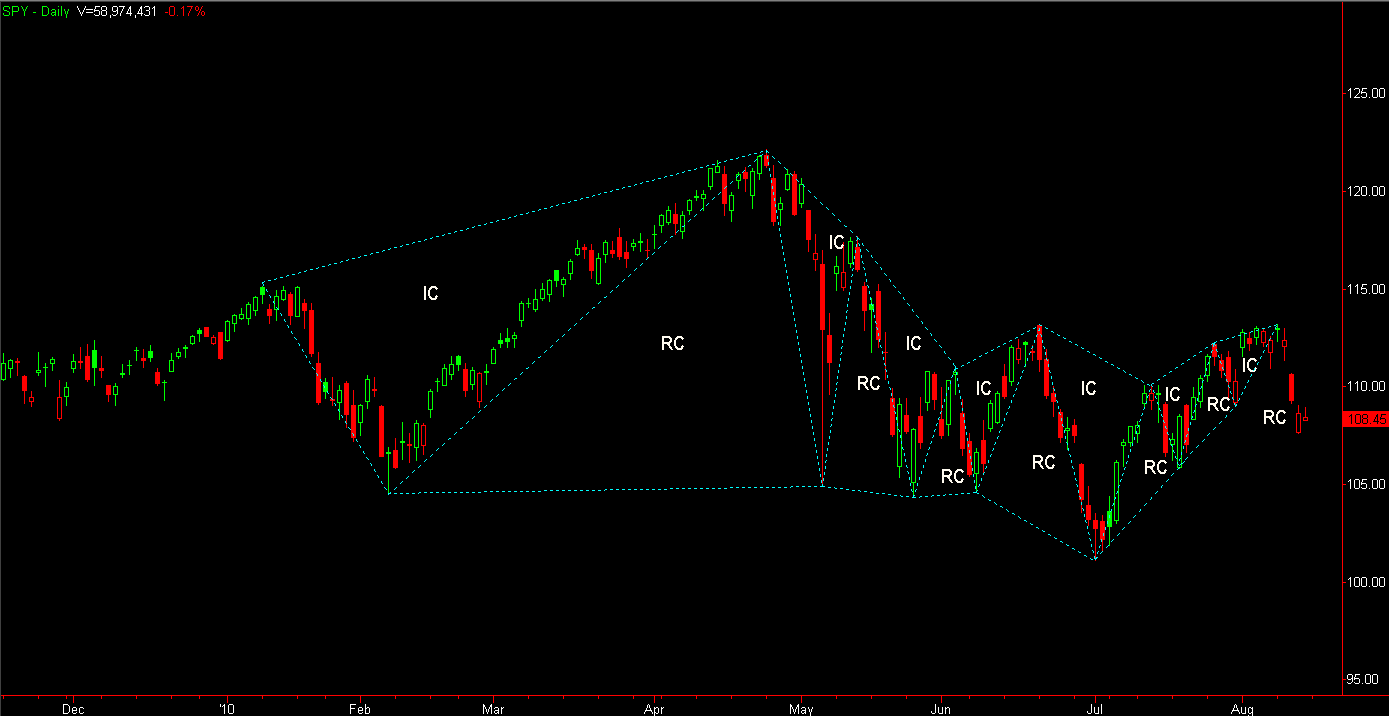 Here's an alternative which shows a little less noise than the one above:
 And here is one showing where the complimentary cycle targets where (solid red lines). The targets weren't met until price started to stabilize after the large momentum thrust:
I haven't done a post regarding the Stevenson PTT in a long time, but that doesn't mean I don't pay attention to the cycles playing out.
Going back to the beginning of the year on SPY, we saw the Inverted cycle complete, while the Regular Cycle target was met early (sign of weakness).

Next we have the "flash crash" selloff that completed our Regular Cycle (RC) leading to our next Inverted Cycle (IC) which is now down. We have two Cycle targets that are still valid:
 - We could just start rallying like crazy to go back to April highs, thereby completing an IC that would be just as wide as our previous Regular Cycle that stretched from Feb. to June.
- The bottom could fall out, confirming a close of our Down IC and giving us an extended Regular Cycle down.Price still seems to be recovering from the flash crash supply dump, and though be it wide, price is range-bound. Recently, we've seen some volatile supply/demand imbalance, which shows itself in wide, steep, and rounded cycles close together, like so:
 The previous Regular and Inverted Cycle targets were met on time (as they often do when you see such symmetry), while the most recent cycle, should complete (and start the next Inverted Cycle) with a close above Thursday's high.Whatever is going to happen it should be a big, strong move as these wide, steep, and rounded cycles close together often precede such moves.We saw this on a smaller scale back in April:
 I also happen to have a screen shot of an intra-day chart that set up this past week in MON:
 This behavior isn't subtle either. The price moves preceding it (in this case, a trend down with relatively average range bars) appear as orderly and typical of the observable environment. Then you get this order flow that is out of the ordinary compared to what came before it, obviously sucking in some positions that needed to cover (bringing fuel to the fire).
updated charts
Some updated charts:
AMZN updated from here; looks like it caught a bid on Friday....see if it can follow-through:
SPY updated from here; $107 support was solid
FSLR updated from here: It caught the bounce from $100, but didn't go that far. Currently flagging as it found some support on $115. The next test will be critical.
AMZN updated from here; looks like it caught a bid on Friday....see if it can follow-through:

SPY updated from here; $107 support was solid

FSLR updated from here: It caught the bounce from $100, but didn't go that far. Currently flagging as it found some support on $115. The next test will be critical.

Friday, June 25, 2010
FCX inverse H&S
FCX has been building a descending channel (congestion channel), recently failed a gap above the upper channel line, pulled back and made a recovery move today on above average volume.
 After testing the gap range for acceptance, price has built a recovery structure, leaving the test of an inverse Head & Shoulders neckline potentially up ahead (measured move extends to $82).


 After testing the gap range for acceptance, price has built a recovery structure, leaving the test of an inverse Head & Shoulders neckline potentially up ahead (measured move extends to $82).


Moving Forks
The moves with the most energy and probability for continuation behind them, often spring from a rejection test beyond support (or resistance), where (considering a down trend in place) a Lower Low (or equal Low) is made followed by the "first" Higher Low.
Once price gets into an area where traders think a Higher Low may take shape (likely a Fib. level), one of two things can happen:
- Continue lower and test the lows, nullifying a presumption that price was making a higher low.
- Move higher to test the previous swing high and see if there is enough demand to make a new higher high.
Should the latter be true, we then have our "seed wave" in place. Given the speed at which this "wave" forms will determine how high and tight it's trajectory may be. Using the pitchfork helps in visualizing this concept: Once this first Median Line is no longer in play we can start using the most recent pivots to give perspective to the trajectory, speed, and energy of price.


Currently POT is in a position where price may be putting in a bottom of some sort:
The most recent pitchfork becomes a process of elimination: This process can also help you to look a little closer at what price is doing
 Eventually the energy will tire once a level is reached where buyers are collectively interested. Until then, you keep moving the Lower Median Line down until the first seed wave holds and the highs above bring demand rather than supply.
Currently the Higher Low in POT stands around $94 (right around the 78.6% retracement), so a test lower and it would seem we could keeping testing lower (even if for just an instant, a new seed wave would then take shape) until volume comes in to support a price. If $94 holds as the Higher Low, $98 followed by $104 can be in play. There is now a Longer-term pitchfork in play, adjusting as our lows are made, and shorter time frame pitchforks to gauge your trading time frame potential setups.
 In this image above the purple pitchfork is nullified. The yellow pitchfork shows price pulling back to the Lower Median Line (LML) that also happens to be the LML of our longer term pitchfork (red). Price showing support at $96 could be a good entry long (as a day trade) imo.
Once price gets into an area where traders think a Higher Low may take shape (likely a Fib. level), one of two things can happen:
- Continue lower and test the lows, nullifying a presumption that price was making a higher low.
- Move higher to test the previous swing high and see if there is enough demand to make a new higher high.
Should the latter be true, we then have our "seed wave" in place. Given the speed at which this "wave" forms will determine how high and tight it's trajectory may be. Using the pitchfork helps in visualizing this concept:
 Once this first Median Line is no longer in play we can start using the most recent pivots to give perspective to the trajectory, speed, and energy of price.


Currently POT is in a position where price may be putting in a bottom of some sort:

The most recent pitchfork becomes a process of elimination:
 This process can also help you to look a little closer at what price is doing
 Eventually the energy will tire once a level is reached where buyers are collectively interested. Until then, you keep moving the Lower Median Line down until the first seed wave holds and the highs above bring demand rather than supply.
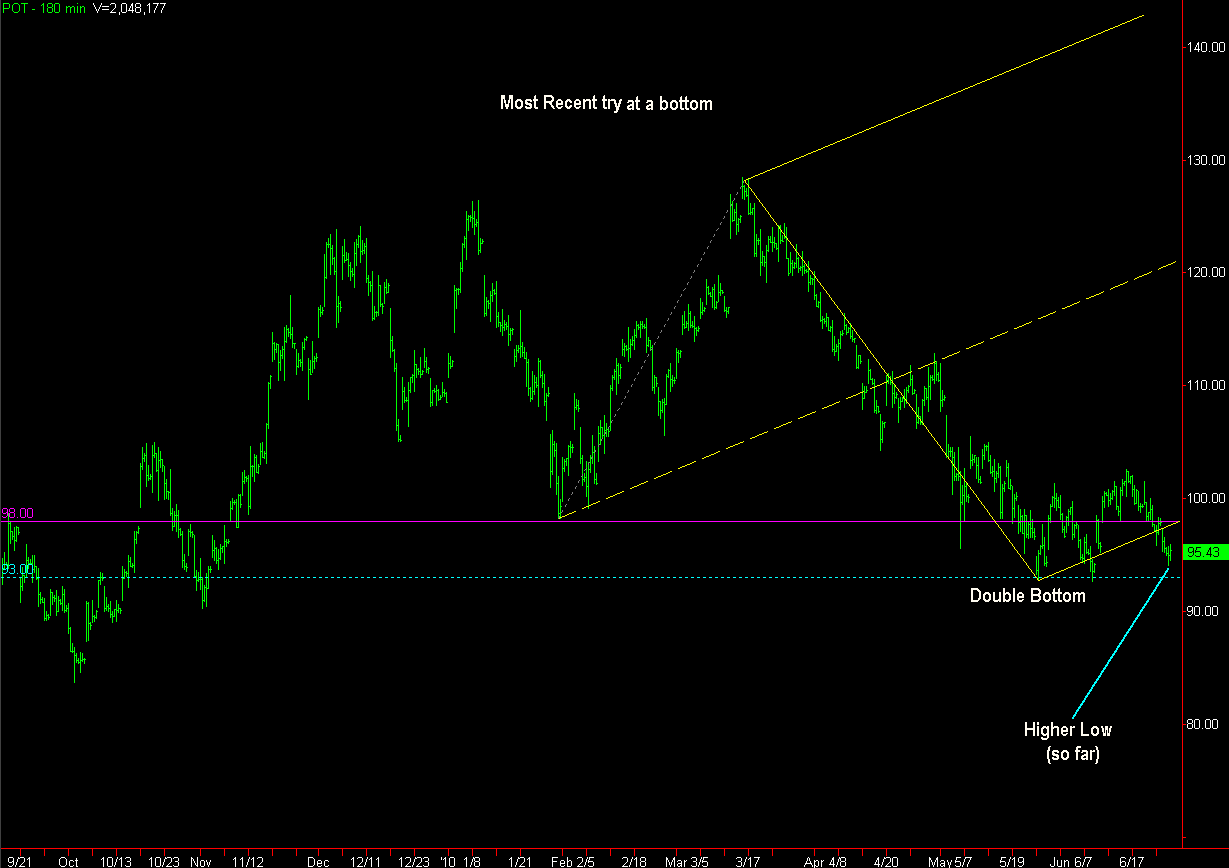
Currently the Higher Low in POT stands around $94 (right around the 78.6% retracement), so a test lower and it would seem we could keeping testing lower (even if for just an instant, a new seed wave would then take shape) until volume comes in to support a price. If $94 holds as the Higher Low, $98 followed by $104 can be in play.
 There is now a Longer-term pitchfork in play, adjusting as our lows are made, and shorter time frame pitchforks to gauge your trading time frame potential setups.
  In this image above the purple pitchfork is nullified. The yellow pitchfork shows price pulling back to the Lower Median Line (LML) that also happens to be the LML of our longer term pitchfork (red). Price showing support at $96 could be a good entry long (as a day trade) imo.
GLD wolfe wave
In a sign of strength the GLD bearish wolfe wave seems to have turned around and may break out into the longer term wolfe wave sweet spot. Still very much in play and volume should be the tell.

Thursday, June 24, 2010
Will it bounce!?
Shortly we should see a bounce or drown moment for AMZN.  Perhaps a bounce higher could bring price back to $140 given a strong market headwind or, at least the midline of $135.
While to the downside, $110 is the low from an Oct. '09 momentum gap up, and $93-ish would be a gap fill and previous Resistance-turned-support level.
The previous two bounces were weak but it should be apparent very soon which way the crowd is leaning.
 Perhaps a bounce higher could bring price back to $140 given a strong market headwind or, at least the midline of $135.
While to the downside, $110 is the low from an Oct. '09 momentum gap up, and $93-ish would be a gap fill and previous Resistance-turned-support level.
The previous two bounces were weak but it should be apparent very soon which way the crowd is leaning.

price has memory
Once of the major tenet's of trading, price has memory.
RIMM reported after hours today. Came in profitable, but below estimates. Here is where price sits at the moment: Since May of 2007 price has used the $56 mark as a respectable pivot.
Notice how the last time price tagged this mark price didn't have quite the response it had in the past.
On tomorrow's open, RIMM will be sold at a discount (compared to the day before) and it will be an opportunity to observe what the buying interest is at this "discounted" price. If the discounted sale price doesn't attract more buyers than sellers (of those who just want to get rid of this POS once it goes below an equilibrium pivot) then me thinks RIMM might end up having a fire sale.
RIMM reported after hours today. Came in profitable, but below estimates. Here is where price sits at the moment:
 Since May of 2007 price has used the $56 mark as a respectable pivot.
Notice how the last time price tagged this mark price didn't have quite the response it had in the past.
On tomorrow's open, RIMM will be sold at a discount (compared to the day before) and it will be an opportunity to observe what the buying interest is at this "discounted" price. If the discounted sale price doesn't attract more buyers than sellers (of those who just want to get rid of this POS once it goes below an equilibrium pivot) then me thinks RIMM might end up having a fire sale.
SPY charts
Just putting them up to reference.
SPY 60-min. with pitchfork drawn off of February lows, April highs, May lows. Sliding parallel lines added. A closer look

SPY 60-min. with pitchfork drawn off of February lows, April highs, May lows. Sliding parallel lines added.
 A closer look
First Cross...ing
SPY weekly chart is showing a 3/10 "First Cross" sell signal. The slow line is beginning to dip into negative territory while the fast line corrects into it (merely pointing out a first lower high in price trajectory). The trigger would be to see a larger (more negative) reading in the histogram's (fast line) current reading (whether it be this bar or the next few).
These tend to me more powerful moves when you have the fast line correct into the slow line as it is crosses into negative territory. Interesting how desperately price is holding on to the Lehman gap level.
These tend to me more powerful moves when you have the fast line correct into the slow line as it is crosses into negative territory. Interesting how desperately price is holding on to the Lehman gap level.

Wednesday, June 23, 2010
GLD Wolfe Wave
A bearish Wolfe Wave setting up in GLD?? For those who have a hatrEd for obscure patterns of price, a wolfe wave is just a way of highlighting narrowing wedges (3-pushes to a top/bottom), so just stop your hating! These types of narrowing wedges play out in an exhaustion move (bear/bull trap at Wave 5) before moving in the direction of the target (1-4 line).
Most recently we have this setup unfolding
 Within the "sweet spot" (#5 point) it would be preferable to see strong volume come in to confirm a bearish suspicion.
On a broader scale however, there is this bearish Wolfe Wave in GLD:
 The "sweet spot" terminates above the $130 level, and volume (like that seen around our #3 point in December) would be a guiding factor. In this instance, the target would come in around the $105 mark (which happens to be previous resistance-turned-support).
Of note: the former bearish wolfe wave can come to complete it's target and the latter bearish wolfe wave would still be in play!
{Updated}

Subscribe to:
Posts (Atom)