
The rules are simply (for a long position) buy the first pullback in the fast oscillator after the slow line crosses above zero for the first time. Obviously for a short the rules are simply the reverse; sell the first pullback in the oscillator after the slow line crosses below zero for the first time. Essentially, this method is indicating a higher high/lower high and, therefore, a place to enter a trend.
To demonstrate, here's a chart from today in HES. I didn't take the first long trade, but I did trade the short position later in the day.
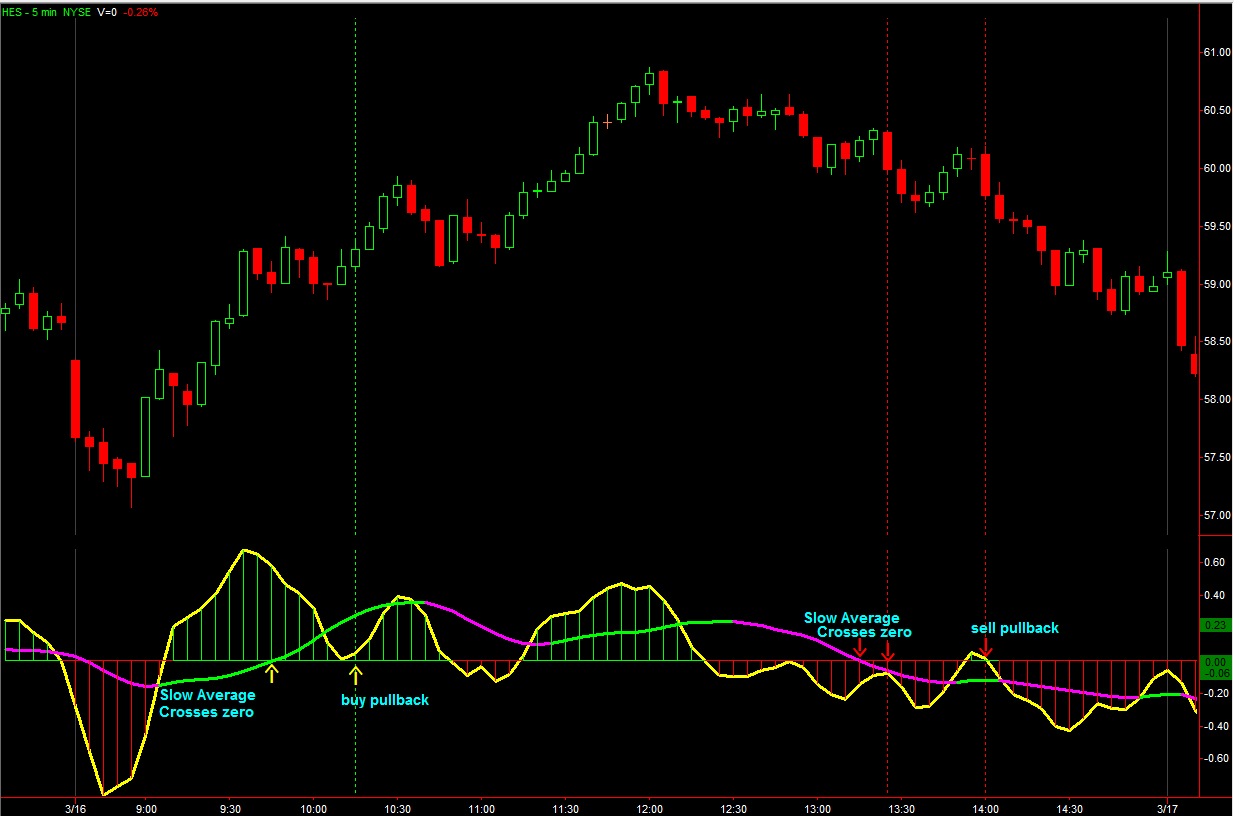
It can certainly be applied to any timeframe, so long as you adjust your risk management appropriately.
2 comments:
Great Interesting piece. I use TOS for my charts and they have a programming language that allows you to plot indicators you construct. I reworked the MACD indicator with the simple moving averages. Here's the code for anyone using TOS:
declare lower;
input fastLength =3;
input slowLength = 10;
input MACDLength =16;
def fastAvg = simpleMovingAvg(close, length = fastLength);
def slowAvg = simpleMovingAvg(close, length = slowLength);
plot Value = fastAvg - slowAvg;
plot Avg = simpleMovingAvg(Value, length = MACDLength);
plot Diff = value - avg;
diff.AssignValueColor(if diff >= 0 then Color.UPTICK else Color.DOWNTICK);
Diff.SetPaintingStrategy(PaintingStrategy.HISTOGRAM);
plot ZeroLine = 0;
Diff.SetDefaultColor(GetColor(5));
Avg.SetDefaultColor(GetColor(8));
Value.SetDefaultColor(GetColor(1));
ZeroLine.SetDefaultColor(GetColor(0));
Enjoy,
DS
http://displacedema.blogspot.com
I use the 3-10 MACD and find the 'slow line' is an excellent tool for seeing and anticipating momentum in the market.
The first cross trade that Linda describes occurs often and can provide some nice trades. The beauty is that you know quickly when you are wrong.
The video is well worth a watch and the ebook is also very helpful.
Trader32
Post a Comment