The setups I include on this blog are used in conjunction with the 3/10macd and the criteria I ascribe to it as a way to alert me to an existing condition of price. The key concept to take away from this blog is that I try to anticipate what will happen on the higher time frame by using a faster time frame to trigger the trade setup. I do not trade a "system" I use two indicators to clue me in to price conditions. Please read the Disclaimer located in the sidebar of this site. I can be contacted via email at toddstrade@gmail.com
I am always open to questions, comments, or suggestions on how to improve this blog.


Showing posts with label 3-push. Show all posts

Monday, March 18, 2013

Mon 03_18

today's trade
A key for the above chart to define the horizontal lines and dots.  For further explanation, see this link:  


Indications of trade opportunity


A breakdown of where we are:

The Daily: gap down price pullbacks that show closes off of the lows (likely short covering as price has yet to scare out larger positions).  Coming into the 20-day MA which coincides with March 5th gap ($153.65 area).  3/10macd anticipation of 1b-1a (continuation of prevailing trend) or 2c (deeper pullback).

A slight timeframe faster, the 130min (3-bars per day) showing 2c and trading between the 20- & 50-period MA's.  Price needing to recover $155.50s, potential steeper pullback to $154?

65min: 3/10macd showing potential 3-push scenario, which can mean an inverse H&S or the potential for a lower low but on lighter momentum.

30-min showing a little clearer the inverse Head & Shoulder potential.  Also, the 3/10macd shows potential for the 3d criteria long setup (Using the 130min paired with the 30min you would have a 2c-2d criteria higher time frame with 3d criteria faster time frame which I treat as bullish.  Still, you would need the 30-min fast line to go green for an entry).
Also worth noting price trading under the 5- & 10-DAY moving averages (purple and black lines respectively).

Basically looking at $155.50 above to be bullish.  Further bearish behavior I'd be looking towards the $153.65 support while giving some credibility to potential double bottom support near today's lows.

Saturday, February 9, 2013

AAPL

For 3 years beginning in 2009 AAPL trended within a buying channel, until price broke out in 2012 and started going somewhat parabolic.  Parabolic moves, where price goes too far too fast, tend to get back-filled, a test to gauge buying interest.  The ensuing correction initially found support at the upper channel but eventually broke through the other end and is now in a throwback to the lower channel line.

It would make sense to incorporate a higher time frame perspective with an equity that has been in a bull market really since 2004.  So, looking at a monthly (log) chart we can put the most recent corrective phase into perspective.

So, though AAPL is in a long-term bull market, it is also (still) in a corrective phase on a faster time frame, and a market can correct longer than most can remain solvent trying to catch the bottom.

Using multiple time frames:

Below is a monthly chart on the left paired with a weekly chart on the right.
 Monthly showing bullish trend still intact while the 3/10macd is showing 2c criteria.  With the slow line still very much positive we eventually anticipate the fast line to start ticking up (2d criteria).  Whether or not price will continue with its bullish trend is too soon to tell.
  The setup I like to look for with the 2c-2d criteria is the 3d criteria on the faster time frame.  So in this case we're looking for the weekly slow line to start turning up while both the fast and slow lines start progressing towards the zero-line (still at least a few weeks off)

Below is an example of the 2c-2d criteria back in 2008.  However, the weekly time frame never did set up the 3d criteria, rather we saw 3a criteria with very eager buyers (very little pullback).  Eventually price rolled over and it was in 2009 we saw the weekly 3d set up with a much more constructive bottoming process (3-push price pattern)

Back to the current environment.  We can expect the monthly 3/10macd fast line to start ticking Up when the faster time frame (weekly) begins to heal (where the fast and slow line start ticking up 3d, 3a criteria).
We can anticipate the healing of the weekly macd by looking at what the daily is doing.
Below, right is the daily, showing the obvious bear trend still intact (though many seem to be very anxious to call a bottom).  Price is pulling into the down-trending 20-MA (criteria 3a).  The slow line is still very negative and quite far from the zero line which means it will take either a decent amount of time or momentum to pull this slow line higher.  Even if we were to see strong momentum which would help pull the slow line closer to zero it would still be more prudent to wait for a higher low pullback.
(I threw in a modified pitchfork because it framed the daily price behavior pretty well.)

If I were looking to buy the anticipation of the weekly macd turning up, then I would be waiting for the daily 3/10macd to pull back THEN tick Up, ideally looking something like this:

To summarize:
   The higher time frame monthly is still bullish, but in a corrective phase.  It's 3/10macd fast line looks as though it may begin ticking up, but this is a monthly chart and a bullish continuation wouldn't be validated until we saw criteria 1a (or, more than likely 2a, the "a" is what is important, which is just saying that the fast line is back to positive) on this time frame, which would take a few MONTHS.
  We can anticipate this by looking to the weekly where we would like to see bullish development in the 3/10macd (i.e. more GREEN).  A slow line trending UP and eventually going positive and a fast line that goes, and remains, positive.  Judging by the looks of the current weekly 3/10macd this may take at least a few of weeks
  So, while the twittOsphere is a-buzz with those hunting for a bottom in AAPL the faster (daily) time frame still remains in a downward trending trajectory and (in my opinion) a buyable opportunity has yet to present itself.  Things may begin to heal once this Daily 3/10macd begins to  build a bullish bias, which will in turn improve the weekly 3/10 macd, which in turn will give us an idea if the monthly will remain in a bullish trend.

The only thing I can think of to compare it to would be the price structure of Gold, which has also been in a bull market for nearly 10-years now and shows similar 3/10macd characteristics (AAPL on the left, Gold on the right below)

Here is how the 2c-2d criteria on the monthly time frame set up on the weekly.  Currently things look they can go either way from here.  A breakout of the overhead trend line could end up turning the monthly 3/10macd fast line higher.  While a failure of support could bring momentum in to the downside and turn into a much larger correction.

Tuesday, February 5, 2013

Tue. 02_05

today's trade
A key for the above chart to define the horizontal lines and dots.  For further explanation, see this link:  

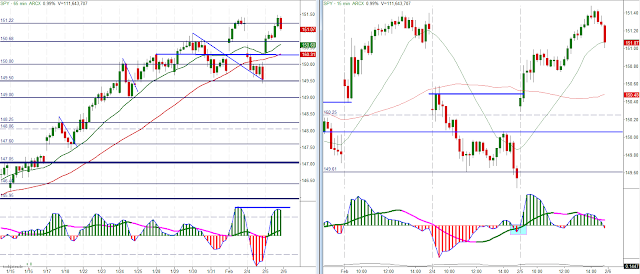
Started off the day with a 3d criteria setup.  Middle of the day was a 2c-2d criteria setup, and finished the day with a 2b criteria short setup.  Slightly higher high today, but a double-top until proven otherwise.

It looks as though it's just a matter of gauging the next pullback.  15-min is in 2c-2d criteria so the current pullback should be supported.  It's the pullback higher (the bounce we can expect from today's late day selling) that will be more telling.  So, I'd be looking to short some sort of XYZ corrective wave on the 15-min, otherwise buy in anticipation of the fast line going green again.

With the symmetrical cycle price pattern taking shape, the Daily chart (below, right) looks like it's putting in a 3-push pattern)

Lastly, today saw the highest ADV./DECL. Volume since this year's rally began.  Which happened to follow the largest NEGATIVE ADV/DECL reading since this rally began.  Seems to smell of distribution perhaps.

Tuesday, January 29, 2013

Tue. 1_29

today's trade:
A key for the above chart to define the horizontal lines and dots.  For further explanation, see this link:  

Breakout again:

Higher time frame showing some selling tails on waning momentum (3-push).  The 15-min showing potential 2b selling (or at least not buying) criteria

Daily showing resemblance to the past few years, price riding the upper keltner channel (2.5ATR band)

Monday, December 3, 2012

Mon. 12_3

Outside Reversal day showing failure at the 50-day Moving Average.  This could potentially be the fourth lower high we've seen since September (see Daily chart below).  A failure to close above $140 in the coming 1-2 weeks could be trouble.  But for now a pullback off of the recent short covering rally was to be expected so it's a matter of gauging the aggressiveness of selling.
Today's Trade:


A key for the above chart to define the horizontal lines and dots.  For further explanation, see this link:  


I'm a particularly lousy scalper in the first 30-45 minutes.  Something I really need to work on.
Also, I feel as though I'm wasting my time sitting through corrective moves.  Today being a perfect example; After my initial target was reached (and half the position removed) I sat through about an hour of a corrective move just for price to come back to my first target.  In the process, a squeeze could have occurred, or price could have formed a higher low, never to see my initial target price.  Likewise, price could have fallen sharply and quickly, but more often than not it feels like the time decay I endure could be minimized.
Maybe it's something that I should consider hedging?  Selling puts?  Buying the QQQ or a levered ETF?  Just not sure.
Not taking the 9:30 short was a complete fail on my part.  The pullback after the ISM report selling was a very obvious pattern (3min chart) in my view.  Even before the "trigger" I should have been shorting that :/

Higher time frame:
Looks like 3-pushes to a high pattern on the 65min chart.  Conditioned bulls will be looking for the "lower high" so I'm thinking $139-138 will see some accumulation.

Monday, September 24, 2012

3rd push

Updating this post HERE.
The SPY has put in a 3rd push lower into the 50SMA on the 130min chart.  So, what I'd like to see on the 30-min chart is either a break above $146 or the 3d criteria for a move to the $146 area.

The daily 3/10macd fast line is still pulling back, and in order to anticipate it moving back up we would like to see the faster time frame (130-min in this case) to turn green.  A gap up above today's high (were that to happen) could give a morning star reversal pattern on the daily.  Under today's lows and things may fall apart.

Monday, April 16, 2012

Mon. 4_15

Some setups from today.
Midday:
 NSC - Relative strength with a bull flag at previous day's resistance.  I missed the 1st up-arrow entry and entering up against the 50% projection (of the smaller seed wave) and so near the IB-high was a "short leash" trade.
Here is how it looked on a 3-time frame perspective.

NFLX - Seeing 3-pushes to a low on the 15-min and a small double-bottom on the 5-min at the IB-low the entry was long with a target of prior breakdown points that coincided with the 50% & 100% projections.  Got out too soon before price tagged the 100% projection

AMZN - into the close trade which didn't amount to much

I didn't take this SPY trade, but it fits a number of trading rule categories.
On Friday we broke down from a momentum bear flag and continued on that path today.  Price found support at the 50% projection (as well as various other technical price points) of that bear flag on a momentum buy divergence (15-min chart) with 3-pushes to a low (illustrated on the 5-min chart).  The 3-pushes formed an inverse H&S (or seed wave) and achieved the 50% projection, overshooting to tag the morning's breakdown point at $137.68.

Wednesday, November 30, 2011

2c

AAPL ....adding this for the sake of having it on here.  2c long entry.  Price pulling back  in a bullish trend.  Price forms somewhat of an inverted Head & Shoulders,  or three-pushes to a low sequence.

 Also, something which stood out for me was the symmetrical cycles which formed, wherein I harken back to the 'ol Stevenson PTT concept.  Red lines are targets based off of the previous cycle and the purple line was the CTL which triggers a long entry.  I actually traded this for a tiny gain as I covered almost to the tick before it rocketed higher....very frustrating

Wednesday, November 9, 2011

Friday, November 4, 2011

repeat

Similar market behavior as the previous day where fading extreme negative TICK readings (-800 with volume support) throughout the day worked well.

Gap-down selling found support (again) at the previous week's Open, coinciding with a demand level from the day before as well as a 100% projection off of the gap (previous day's Close to today's Open).
Earlier in the week I highlighted the 2c setup and the reverse divergence, which is what we got this morning.  Notice how the 5-min 3/10 macd forms a 3-push divergence and then triggers a 3d setup giving us a seed wave.

Monday, October 10, 2011

SPY weekly

First day of the week, so no telling how this weekly chart's candle will close, but a couple of patterns stand out.
On the weekly; 3-pushes to a low followed by a gap above the down trend line and 3d criteria on the 3/10macd indicator.
On the daily;  A momentum buy divergence at the bear trap.  The first test of the 50-day MA since 08/01 and we gaped at it and closed strongly above it.  $120 looks like obvious resistance, a test of which would give a reverse (sell) divergence (higher high in momentum, lower or equal high in price).   All of which would set up a very buy-able dip.
Closer look at the weekly.  A rally back to $127 would set up a reasonable short opportunity :

Wednesday, September 14, 2011

SMH 3 pushes

3-pushes to a low in the SMH 


This is the first time since July 26th that price has tested the 50-day MA.  The Fibonacci projections are based off of the most recent seed wave (low of 09/06 to the high of 09/08).  Price seems to have met with some supply at the confluence of this 50% Fib. projection and the 50-day MA.
Looking at the volume makes me wonder if this wasn't some sort of stop-sweep behavior that strong hands were selling into, but it doesn't make sense that it would be actual buyers coming in AT THIS LEVEL?   Being that price is under the 200-day and 50-day MA and price makes a corrective move into a Moving Average that hasn't been tested in 35 trading days, do you think the "smart money" is buying at this level (causing that volume....aside from the fact that it is Triple Witching OpEx week which tends to skew volume levels to begin with).  There is a ton of overhead supply to chew through and maybe we will, but the simple observation remains; price, in this particular market, is in a bearish orientation which often favors a fading resistance.
And if you're not convinced then what does this chart below tell you?  More than half of today's volume came in the selling frenzy that occurred in the last 30-minutes of trading:

add-on

Forgot to include this in the previous post, but here was another example of the 3-pushes to a low setup in GS intraday:

Tuesday, September 13, 2011

3-Push

An example of the 3-push setup (A setup highlighted in Linda Raschke's book Street Smarts (also known as Three Little Indians, Three pushes to a High (or Low), etc.
The SPY almost had two of these setups today.  However, the first 3-push move didn't make a lower low on the 3rd push, thereby creating more of an inverse H&S instead (notice the 3d criteria which often draws your attention to a right shoulder for this setup).  The actual 3-push came at the highs of the day and with a day where buyers are in control it's always best to short a retrace once momentum has shown itself rather than the initial trend line break.


Instead of taking the SPY short I actually entered TZA long based on the 15-min 3d setup (and the 3-push short setting up on the SPY AND the TZA showing a 3-push pattern on the 15-min chart).  There are two arrows marking possible triggers to entry, my entry was actually on the 50% retracement level.  Exited half at the 50% projection while the 100% projection missed by 8-cents so the other half was taken off as price went under the bearish red inverted hammer candle on the 5-min.