The setups I include on this blog are used in conjunction with the 3/10macd and the criteria I ascribe to it as a way to alert me to an existing condition of price. The key concept to take away from this blog is that I try to anticipate what will happen on the higher time frame by using a faster time frame to trigger the trade setup. I do not trade a "system" I use two indicators to clue me in to price conditions. Please read the Disclaimer located in the sidebar of this site. I can be contacted via email at toddstrade@gmail.com
I am always open to questions, comments, or suggestions on how to improve this blog.


Thursday, September 29, 2011

hmmmm

If you squint hard enough things are actually looking a tad bullish here.  It's possible this is turning into another bullish impulse wave which today held a 61.8% retrace.  Price actually coiled/consolidated against this level for 90-minutes until breaking higher into the close and looks to be breaking out from this down sloping trend line. 

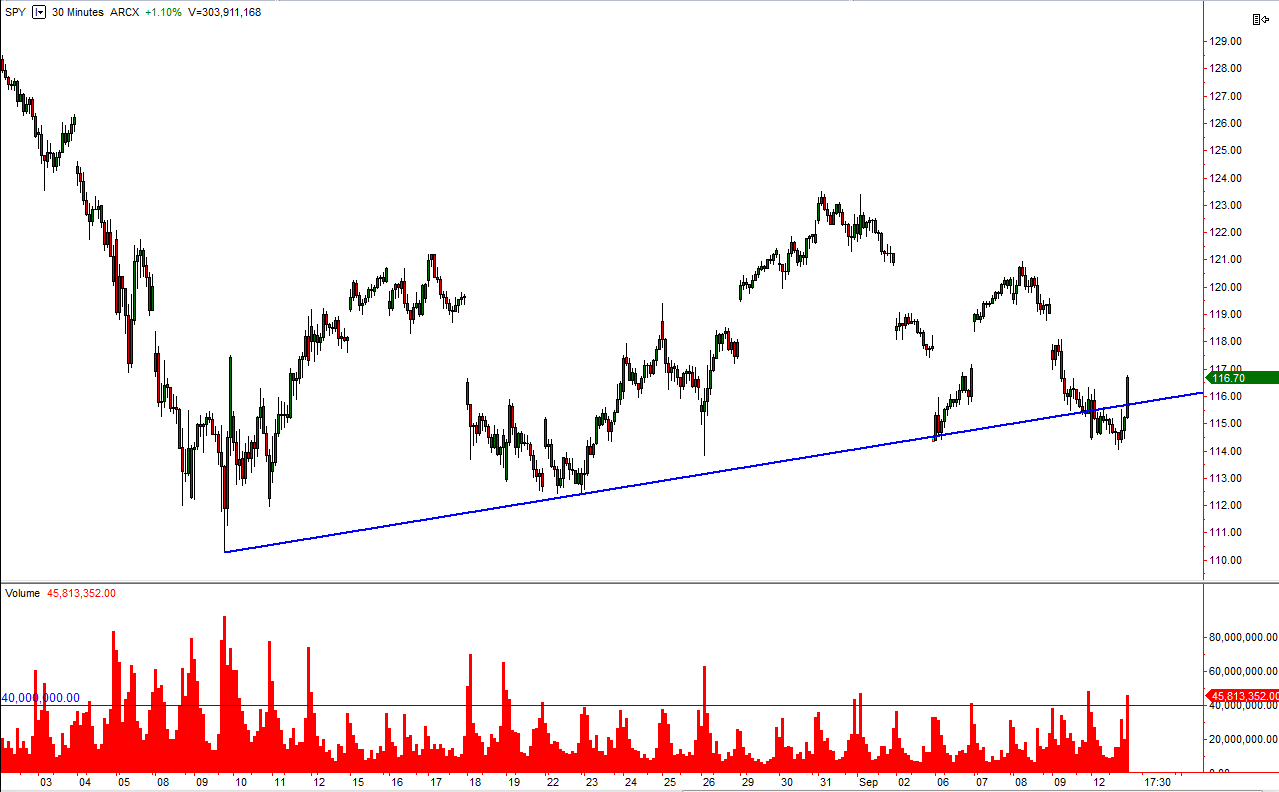
SPY - Third test of support, followed by a momentum push up and a tight flagging retrace which held its 61.8% retrace today). So long as these 22nd lows aren't breached we'll have a higher low off of support (so we will next have to take out the 27th swing high above $119).  If bulls step up at $119 price could launch higher.  

IWM - $64.5 support held and price sprang higher today, a similar double-bottom that occurred in early September.  Looking toward $67.5 resistance while a break above $68.50 could keep prices going higher.

QQQ  - Double-bottom after Aug. 22nd and price has held $53 on numerous tests since then (big level to watch if we happen to move below it, otherwise to $55-55.5 resistance and a move over $56 could extend a move even higher.

DIA - a double bottom at $106 followed by a momentum move that is currently flagging.

There seems to be a case for the bulls here (at least for a relief rally), the ball may be in their court, we just need to see follow-through in that direction.  Of course upper resistance will be shorted, but that may be the exact catalyst a rally requires (short covering).

Also worth watch for a clue is how Crude performs out of this trend line after successfully testing the $78 support (though volume sucked at the most recent test)


And here's the ES; broke out of this channel/flag following a bullish impulse off of support.  Volume at support on the 22nd was quite strong.


Wednesday, September 28, 2011

Follow the Volume

Price broke down from its triangle/flag/whatever. It has since retraced to test the breakdown point and, seemingly, failed today. By Friday we will likely have a decisive momentum move.

A bullish outcome still has a chance, but the advantage isn't favoring that direction

Monday, September 26, 2011

another

3d entry in POT
Took the 2nd up-arrow as the entry at the 50% Fib. retracement didn't fill.  Left with the feeling of chasing price is never fun, but my stop was only 20-cents.  Exits taken at exactly the 50% & 100% projections.

close enough

To a 3d long entry today in AAPL
Entry was at the 50% retrace of the initial impulse (second up arrow).  First exit was taken at the Open price (don't know why I didn't just let it play out).  Second exit at end of day as it tagged the 100% projection.

Thursday, September 22, 2011

Tuesday, September 20, 2011

FAZ end of day

FAZ long entry into the end of the day.  A 3d setup;  Entered on the 1st arrow (to the left) but scratched it.  Entered again on the 2nd middle arrow, though a better entry may have been to wait for the 50% retrace (3rd up-arrow.  Trailed stop as price tested the open and half taken off at the 100% projection.  Second half taken off in the last 10-minutes.


Friday, September 16, 2011

Two updated charts from previous posts
The SPY from this post; 50-day MA test looming as price pushes into this resistance zone.  Still has the complex H&S pattern on waning momentum.  However, this market has resolved those issues in the past by gaping over the resistance and squeezing higher.  So, a gap above the 50-day MA could just cause a squeeze educed rally so be prepared for the irrational.

and the SMH from this post.  Pushes higher and the air is looking thin up there with a doji followed by a shooting star/inverted hammer and closing under a resistance level.  It certainly could withstand a pullback and be in a good position for dip buying.

Wednesday, September 14, 2011

SMH 3 pushes

3-pushes to a low in the SMH 


This is the first time since July 26th that price has tested the 50-day MA.  The Fibonacci projections are based off of the most recent seed wave (low of 09/06 to the high of 09/08).  Price seems to have met with some supply at the confluence of this 50% Fib. projection and the 50-day MA.
Looking at the volume makes me wonder if this wasn't some sort of stop-sweep behavior that strong hands were selling into, but it doesn't make sense that it would be actual buyers coming in AT THIS LEVEL?   Being that price is under the 200-day and 50-day MA and price makes a corrective move into a Moving Average that hasn't been tested in 35 trading days, do you think the "smart money" is buying at this level (causing that volume....aside from the fact that it is Triple Witching OpEx week which tends to skew volume levels to begin with).  There is a ton of overhead supply to chew through and maybe we will, but the simple observation remains; price, in this particular market, is in a bearish orientation which often favors a fading resistance.
And if you're not convinced then what does this chart below tell you?  More than half of today's volume came in the selling frenzy that occurred in the last 30-minutes of trading:

post

posted this on Chart.ly last night...still remains relevant and the complex Head & Shoulders pattern is still in play. Overhead resistance approaches:

add-on

Forgot to include this in the previous post, but here was another example of the 3-pushes to a low setup in GS intraday:

Tuesday, September 13, 2011

3-Push

An example of the 3-push setup (A setup highlighted in Linda Raschke's book Street Smarts (also known as Three Little Indians, Three pushes to a High (or Low), etc.
The SPY almost had two of these setups today.  However, the first 3-push move didn't make a lower low on the 3rd push, thereby creating more of an inverse H&S instead (notice the 3d criteria which often draws your attention to a right shoulder for this setup).  The actual 3-push came at the highs of the day and with a day where buyers are in control it's always best to short a retrace once momentum has shown itself rather than the initial trend line break.


Instead of taking the SPY short I actually entered TZA long based on the 15-min 3d setup (and the 3-push short setting up on the SPY AND the TZA showing a 3-push pattern on the 15-min chart).  There are two arrows marking possible triggers to entry, my entry was actually on the 50% retracement level.  Exited half at the 50% projection while the 100% projection missed by 8-cents so the other half was taken off as price went under the bearish red inverted hammer candle on the 5-min.

Monday, September 12, 2011

Classic

Some very simple and classic technical price patterns playing out today, irregardless of a news announcement and the start of OpEx week.
15-min:
Down trend lines broken and price returned to the higher time frame down trend line. The 3/10macd indicator showed a three-push pattern which price was breaking out of into the close on Friday. The gap down this morning negated the bullish setup (and probably trapped some longs), but by the end of the day the momentum was waning into the selloff, creating a momentum buy divergence.  The ensuing short-covering on any whisper of news coincided with the shorter-term trend lines being broken.

5-min
The triangle breakdown was choppy, occurring on two buy divergences. The "news rally" short covering momentum broke out from the trend lines and a 50%-61.8% retrace held as support before continuation (seed wave).

Another trend line held as a result of this bear trap late in the afternoon; a longer term trend line.  It should be telling once we see the reaction from this initial move.  Either buyers take the ball and run with it, or sellers fade it and force those buyers into sellers:

Saturday, September 10, 2011

Friday, September 9, 2011

This Flag of Ours

The bear flag that is all the rage now:

zoom in...

SO FAR....price has held the lower channel, and has done so triggering a 3d long entry (highlighted).

Which means we could get a decent shakeout rally to test overhead resistance.  If the most immediate resistance holds then we could look for a mini flag at this lower channel before rapidly lower price discovery.
The 15-min 3d setup may go green at this point which indicates a shot at some overhead targets/resistance, so it's a matter of gauging rejection or acceptance at those higher levels.


 The higher time frame has a bearish leaning (Daily showing a tick down in the fast line (2c criteria which hints at a possible continuation sequence lower).  We could have a quick test lower that is met with buying (perhaps a low on softer momentum), just as we could have a rapid test upward that is met with rejection.

Further split time frames; could test higher, watching for sign of strength or weakness at the overhead resistance (red) or lower support (green) levels.  A serious vacuum could open under the $112.25 area

Monday, September 5, 2011

Dollar on the move

It has been 3-weeks since I posted the 3d setup in the U.S. Dollar Index (follow this link).  It triggered another entry at the end of last week and had some follow-through today.

Thursday, September 1, 2011

Update

From a previous post Re: a 3d long entry on the daily chart in SPY.  The close today gave an "official" sell signal if profits were not taken with the failure of price to overcome the 50% projection.


3d setups

3d setup in FCX this afternoon.  Didn't fulfill its targets (hinting at weakness ahead).

 
Same setup in GS later in the day.   Got a good entry long @ $112.16 but gave up on it at the average of $113.

Getting the feeling GS was rolling over I shorted the bear flag ($112.55) and AGAIN couldn't get my 100% Fib. target.