The setups I include on this blog are used in conjunction with the 3/10macd and the criteria I ascribe to it as a way to alert me to an existing condition of price. The key concept to take away from this blog is that I try to anticipate what will happen on the higher time frame by using a faster time frame to trigger the trade setup. I do not trade a "system" I use two indicators to clue me in to price conditions. Please read the Disclaimer located in the sidebar of this site. I can be contacted via email at toddstrade@gmail.com
I am always open to questions, comments, or suggestions on how to improve this blog.


Showing posts with label ABC. Show all posts

Thursday, September 27, 2012

Thu. 9_27

SPY reclaiming the 20-day MA

SPY with TICK below.  Morning selling capped off at the overnight lows.  First test of the open swing high was rejected but later broke out from this range.

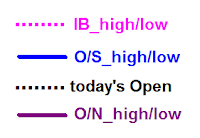
A key for the above chart to define the horizontal lines and dots.  For further explanation, see this link:     
Advance/Decline started off strong this morning while the Up/Down volume trended higher all day

15-min and 5-min with 3/10macd below.  Slow line back to positive with a breakout of the previous range.  


Thursday, September 20, 2012

thurs. 9_20

SPY with TICK & volume.  Significant volume at the lows of the morning (on a + TICK div) as well as on the low TICK of the day at the IB_high.  Notice the 1:30-2:30 negative TICK div (perhaps a sign of a small squeeze, forcing shorts to cover)

A key for the above chart to define the horizontal lines and dots.  For further explanation, see this link:
Advance/Decline issues trended up all day with price while the Up/Down_volume trended down, but rounded and turned after 1:00pm. 
SPY 15m & 5min with 3/10macd below.  First up arrow long entry was taken at the prior bar because of the inherent strength.  Blue arrows are entries, black arrows are exits.

Wednesday, September 19, 2012

AAPL 2c-2d

Another 2c-2d criteria in AAPL today.
The first long trade wasn't much of a performer, however the resulting pullback formed a nice flag that had a decent measured move.

Wednesday, September 12, 2012

Wed. 9_12

Today's SPY with TICK.


Indications given to TICK divergences at meaningful price levels:
First Up arrow - higher TICK low on lower low in price just above overnight low.
First down arrow - High TICK of the day on a lower price high at the Opening price
Second down arrow - Higher high in price lower high in TICK at the opening swing high and just shy of IB_high.
Second up arrow - Lower low in price higher low in TICK (both sequentially and for the day), hammer candle at overnight low again and near gap fill.

A good example of the A/D-line bouncing at zero

Here's a messy one - this chart is to highlight the 3/10macd and looking to trade a continuation move, which is reflected in the fast line correcting off of the slow line.  A bullish continuation move is labeled A-B-C
while a bearish wave is labeled X-Y-Z.  Essentially, I'm looking to position myself after the "B" point (bullish) in anticipation of at least the C point (re-test), but hopefully more (the continuation).  Likewise, if bearish, I'm looking to position myself around or after the "Y" point, in order to anticipate a re-test of support or continuation beyond.


So, going into this morning we had a gap up (bullish momentum) giving us our "A" point.  We then corrected ("B") then tried to test resistance "C".  The 5-minute chart on the right shows an entry long, which was exited just above vwap after failure of the opening price.
The first down arrow reflects a short entry for anticipation of the "Z"  aspect of an XYZ wave.  More or less a scratch trade.
Second up arrow, a long entry in anticipation of the C1 move resulting from the A1-B1-C1 wave (also inverse H&S (sort of) on 5min).  Not a premium exit, the rejection was pretty quick.
Two down arrows because I scaled back and then went back in between those two bars (amateur).  Fib projection showing price targets.  This short was based on anticipation of the X2-Y2-Z2 wave.

Thursday, May 28, 2009

shake-out

Price was nice and orderly on the gap-up for the first 25-minutes as we went sideways along the pivot line, forming a small triangle. Failure led to a nice swift move down. I mentioned a couple of days ago a strategy to play off of a gapping open that worked nicely today (if price gaps up, and price comes back to the previous day's close then look to go short, the opposite being true for a gap-down coming up to PDC. Of course the size of the move back to PDC is going to be a factor in making the trade).
Being that keeping count of Elliott Waves just hurts my brain, I like to use a more simplistic approach in following price structure. A count known as the "ABC" Price Pulse which I learned about through a L.B.R. presentation.
It's simply a price impulse, followed by consolidation, followed then by another price pulse. The following chart of today's SPY on a 5-min basis was a perfect example of this concept.
I have also included numbers (1, 2, 3) which represent another concept (again, discussed in the above link's presentation) where a price impulse tends to have 3 pushes to them. Also, take note that the "B" wave is a construct of a flag pattern. Allow the chart to illustrate, hopefully it's not too confusing.Conceptually, it goes something like this; The A-wave is where volume/size comes in and moves the market after being in a sideways/indecisive/equilibrium level. The B-wave follows where the early-birds distribute (take profits) on part (or all) of their position, while late-comers join in and the additional volume brings price down in the final C-wave.

Anyway, there were a couple of things tipping off a potential bottom in today's early morning sell-off; a TICK divergence (also notice that the TICK didn't get overly bearish, even at it's lowest level), which also appeared on the 15-min chart as a momentum divergence, and to a lesser extent, the resilience of this lower channel line which given support on two other occasions (yellow support line within the 15-min chart).
Speaking of shake-out, here's a trade I got shaken out of today because (1) I didn't give it ample wiggle room, and (2) I was distracted with a 1-minute chart (hence the shakeout) , while I should have kept focus on the larger time-frame (5-min) and my strategy behind the trade. Why I didn't get back in is beyond me. The strategy behind it was a simple gap-fill, with confirmation given in the form of an ascending triangle and price basing at previous support.