The setups I include on this blog are used in conjunction with the 3/10macd and the criteria I ascribe to it as a way to alert me to an existing condition of price. The key concept to take away from this blog is that I try to anticipate what will happen on the higher time frame by using a faster time frame to trigger the trade setup. I do not trade a "system" I use two indicators to clue me in to price conditions. Please read the Disclaimer located in the sidebar of this site. I can be contacted via email at toddstrade@gmail.com
I am always open to questions, comments, or suggestions on how to improve this blog.


Showing posts with label Normal Variation Day. Show all posts

Monday, April 8, 2013

Mon 04_08

today's trade
A key for the above chart to define the horizontal lines and dots.  For further explanation, see this link:  

Breadth - Started out neutral/bearish.  Afternoon breakout coinciding with IB_high break.

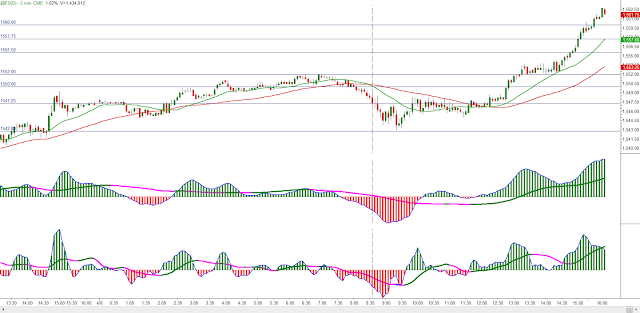
ES globex - Dash vertical is the market Open.  Top indicator replicates a 15m 3/10macd while the bottom one is a 5min (Two time frames in one).

Volume Profile - The day started out as 'Non-Trend' day (Small IB_range & D-shaped profile) but turned into 'Normal Variation' day (IB_High broken as OTF became active). <- Might have been a Double-Distribution trend day?

Trades - Early, frustrating chop paid off later on

Quite the move we've had here

Important week in determining follow-through or rejection.  For now, the trend is still very much intact

Friday, April 5, 2013

Fri. 04_05

today's trade
A key for the above chart to define the horizontal lines and dots.  For further explanation, see this link:  

breadth- strongly bearish all day, but also Advance/Decline (which of course closely mirrors the S&P) trending higher all day

Took half my long position in the morning for a loss, had I just kept my ATR stop in place the position would have worked itself out.  The 5-min chart is using a 'gapless' 3/10macd.  I prefer to default to this indicator on large gap days.  The up-arrows, representing long trades, indicate entries, not necessarily "triggers" based on the 3/10macd

  
The following volume profile chart is a bit of a screw-up.  I had intended on using red for HighVolumeNodes and Blue for LowVolumeNodes but, as is obvious, I mixed the two up on some instances.  Irregardless, you can figure them out:

The higher time frame, though showing obvious criteria (price in corrective mode) it's not very easy to swing trade.
When shorts are slow to cover and buyers hibernate, it's called a 'Bear' market. This just isn't a Bear market.  Shorts are quick to cover and temporary buyers feed the fuel to that covering.