AMZN long off of an inverted hammer bottoming seed wave.
On the faster time frame you can better see the bottoming pattern trace itself out. It's a reliable pattern to watch for to trade a bottoming pattern intraday; kind of an inverse H & S with two heads; with either a slightly lower low as in this case or, just as valid, a slightly higher low
Look closer at the 15-min chart, it's tracing out the same chart pattern as the one outlined on the 3-min chart above. Look to buy $214 on Monday if price holds that support, if it fails it, look to short $214 on retest.
The setups I include on this blog are used in conjunction with the 3/10macd and the criteria I ascribe to it as a way to alert me to an existing condition of price. The key concept to take away from this blog is that I try to anticipate what will happen on the higher time frame by using a faster time frame to trigger the trade setup. I do not trade a "system" I use two indicators to clue me in to price conditions. Please read the Disclaimer located in the sidebar of this site. I can be contacted via email at toddstrade@gmail.com
I am always open to questions, comments, or suggestions on how to improve this blog.
Showing posts with label chart patterns. Show all posts
Showing posts with label chart patterns. Show all posts
Friday, July 22, 2011
Monday, July 18, 2011
Posted this chart a few times last week as it updated. We broke down from our up-trend line and are in a throw-back process that coincides with a down trend line. TICK is diverging positively so far.
Price has reached the measured move from the H & S pattern mentioned last week and filled the gap left from 6/28 coinciding with a 61.8% retracement
Had a bunch of support levels close together at these 1290 levels on the ES, corresponding to the 61.8% Fib. retrace
The ES came just shy of a 150% projection off of its seed wave setup and continues to test lower
Wednesday, July 6, 2011
I'll Buy That
Green hammer on the 15-min chart, I'll buy it any day
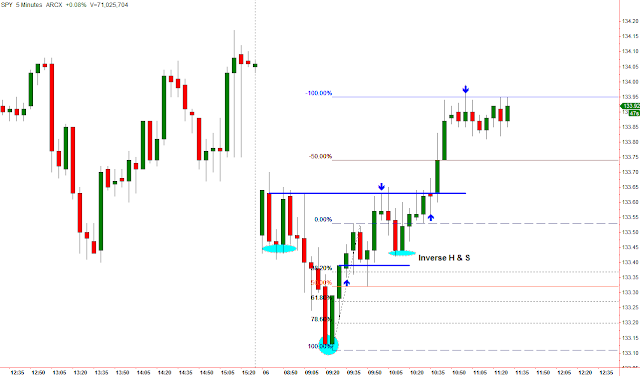
5-min breaks down as such; entry off the break of the 15-min hammer bar's high, exit as resistance. Second entry based on inverted H&S, exit at 100% projection of the initial wave
5-min breaks down as such; entry off the break of the 15-min hammer bar's high, exit as resistance. Second entry based on inverted H&S, exit at 100% projection of the initial wave
Thursday, April 21, 2011
sucky trades
AGU from Wednesday. Short attempt, got stopped out after putting a tight stop above the narrow range consolidation (horizontal line and up arrow). Was good for about 30 cents, so I guess it wasn't that sucky.
VLO from today. I had higher hopes for it, but couldn't stick around for it to work at the end of the day, so I took myself out when price came back below $28.90, which I believe gave me 7-cents!
VLO from today. I had higher hopes for it, but couldn't stick around for it to work at the end of the day, so I took myself out when price came back below $28.90, which I believe gave me 7-cents!
Tuesday, December 14, 2010
rounded top?
Who out there considers this to be a rounded top in the SPY? Remember, a rounded top can break out in either direction! Vote now!!
If I don't get more than 10-votes I'm closing this blog and nuking the contents....tick, tock, tick, tock...
If I don't get more than 10-votes I'm closing this blog and nuking the contents....tick, tock, tick, tock...
Subscribe to:
Posts (Atom)


