The setups I include on this blog are used in conjunction with the 3/10macd and the criteria I ascribe to it as a way to alert me to an existing condition of price. The key concept to take away from this blog is that I try to anticipate what will happen on the higher time frame by using a faster time frame to trigger the trade setup. I do not trade a "system" I use two indicators to clue me in to price conditions. Please read the Disclaimer located in the sidebar of this site. I can be contacted via email at toddstrade@gmail.com
I am always open to questions, comments, or suggestions on how to improve this blog.


Showing posts with label 3a. Show all posts

Saturday, March 1, 2014

GC

Gold targets met on higher time frame.
Monthly (below, left), weekly (below, right)
The initial entry on the weekly has hit a secondary objective, while taking the second entry resulted in 3R coinciding with the 50-period SMA and an overhead trend line.

The daily (below, right) has a fast line < slow line hinting at potential pullback/consolidation.  Though if the fast line turns back up abruptly we would likely see a continuation move.


Monday, January 20, 2014

GC

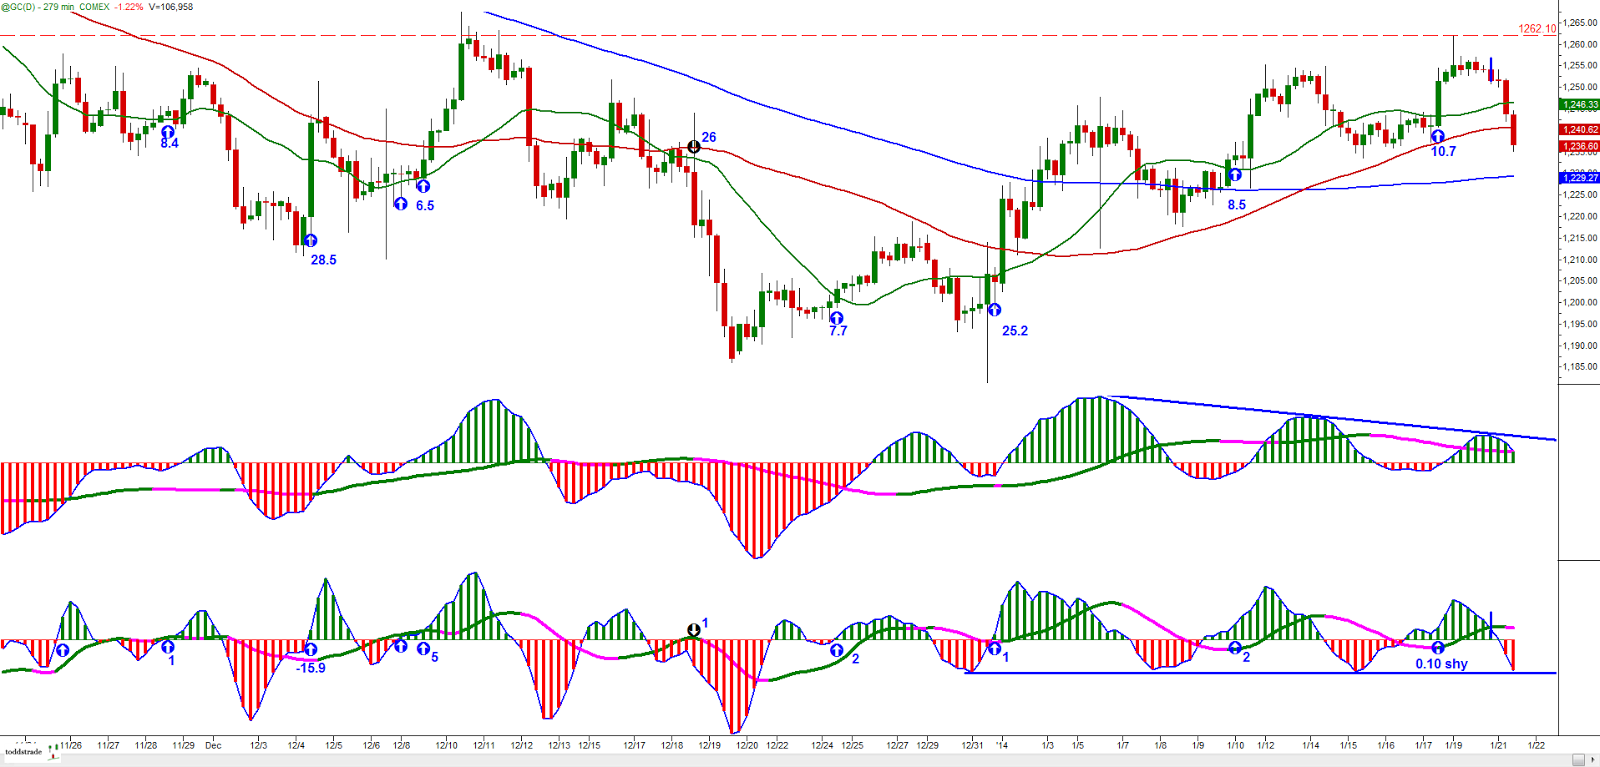
Updated chart from the ones below, to show the fast line/slow line cross providing a warning if long

Actually a bit surprised that Gold continues to squirm higher.
The daily is putting in fairly symmetrical cycles and is at a point where one side will show their hand and we'll see if bulls or bears are stronger here.  The bulls have a double-bottom on their side, while the bears have everything else (moving averages, trend lines, and overall trend).

The 4-hour came so close to it's initial target.  It still has an opportunity to achieve it, but it can be sketchy holding a position on a fairly late entry so close to resistance (a for sure exit would be the fast line/slow line cross on this time frame's 3/10macd (lower subset indicator).

a better look at the cycles

Thursday, August 1, 2013

Thu 08_1

Resistance overhead?  Just gap over it!
 A key for the above (5-min) chart to define the horizontal lines and dots.  For further explanation, see this link:  

Arrows on higher time frame indicate anticipatory trades that are entered using the faster time frame.

ES_with globex;  best entry was 10-min prior to Open; arrows indicating potential entries (no exit signals are indicated)

HIgher time frame; Daily (below, right) had 2c-2d criteria, entry was 3d-3a criteria setup on faster time frame

Monday, May 6, 2013

Mon 05_06

A key for the above (5-min) chart to define the horizontal lines and dots.  For further explanation, see this link:  

Volume profile coming into the day.  Though Friday was a momentum day, it wasn't a trend day, more of a "Normal" day type (Wide IB with IB High/Low retained.
 

Higher time frame - looking for the 3/10macd fast line and slow line to catch up with one another (on the 65min) for any further long considerations.

ES with Globex and long entries considerations

Thursday, May 2, 2013

Thu. 05_02

A key for the above (5-min) chart to define the horizontal lines and dots.  For further explanation, see this link:  

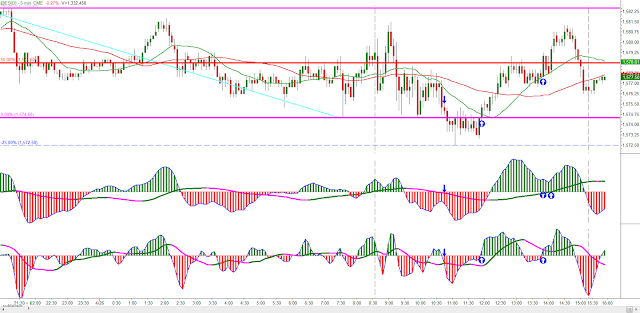
ES with Globex - didn't take the entry for this in the morning, it was the bar preceding the bar with the up arrow on the 5min chart above (the bar before the one with an "X" underneath it).

Breadth - started out moderately strong from the open, broke out above 200k by 11:00am

Volume Profile coming into the day - Shorts not going to press anything into the numbers tomorrow. Opened right under a HVN  then proceeded to move higher through the next two HVN's

A good example, on the higher time frame, where a sell divergence in a momentum indicator doesn't mean price has to go down.  The daily 3/10macd showing a sell divergence and a down-ticking fast line, yet closed at a higher high

Pretty neat that the ES closed at a lower high, just under 1600 going into tomorrow's  numbers.  Can go either way

Saturday, April 27, 2013

Fri. 04_26

Got a bit chopped up in the morning and had to leave just as the noon trigger was occuring.  Difficult taking a short when the 5-min slow line has a positive slope (criteria 3).

Very choppy in the morning as price was working in the previous High Volume area from the 24th ($157.99)

ES with globex.

Thursday, April 4, 2013

Thu. 04_04

today's trade
A key for the above chart to define the horizontal lines and dots.  For further explanation, see this link:  


Breadth - neutral to bullish most of the day, strengthening into the close

SPY with premarket


Intraday SPY

Opening Swing and First hour of trade

Neutral Inside day

Updated higher time frame charts from previous post...the bullish development began taking place into the end of day, but there is still the chance of price rolling over bearishly


Friday, March 22, 2013

Fri. 03_22

today's trade

More trades than usual....very 'risk management' sort of environment...nice 5-min bar end of day huh?  Which way do you think we'll gap up on Monday? :)

Daily showing a tick up in the 3/10macd with a price pattern that you want to see for a continuation move.  Weekly still in condition 1a!

Tuesday, February 19, 2013

Tue. 02_19

today's trade

A key for the above chart to define the horizontal lines and dots.  For further explanation, see this link:  

Having a hard time holding and adding

Nothing's changed, we move up, we cosolidate, we move up

Thursday, February 7, 2013

Thu. 02_07

today's trade:

A key for the above chart to define the horizontal lines and dots.  For further explanation, see this link:  


Wish every day were like today.
The 4c criteria (like the 1a criteria) is more about trading price breakouts (using "breakouts" to be synonymous with "breakdowns").
I was late coming into the first short this morning

but if you go to a faster time frame you can see the ideal entry.

Higher time frame:  Ball back in Bulls court...so long as this lower high doesn't hold


An update on the cycles posted the other day.
  I'm suspecting it's either a complex Head & Shoulders, or a broadening wedge with a "Partial Decline".  Either way, above 1512 (SPX Cash Market) or under 1500 seem to be the bull/bear lines.


Saturday, January 26, 2013

Fri. 01_25

the day's trade:
A key for the above chart to define the horizontal lines and dots.  For further explanation, see this link:  

Got chopped up a bit, first two longs were scratch trades. third was a point loss, fourth just over a point gain.  Glad I wasn't around for the last 10 minutes.

Higher time frame showed some choppy signals on Friday....

Weekly showing a breakout on confirming momentum.  Daily is super-stretched, but nobody seems to care about that (Keltner channels overlaid.  One is 2.5 ATR, the other 5 ATR)