The setups I include on this blog are used in conjunction with the 3/10macd and the criteria I ascribe to it as a way to alert me to an existing condition of price. The key concept to take away from this blog is that I try to anticipate what will happen on the higher time frame by using a faster time frame to trigger the trade setup. I do not trade a "system" I use two indicators to clue me in to price conditions. Please read the Disclaimer located in the sidebar of this site. I can be contacted via email at toddstrade@gmail.com
I am always open to questions, comments, or suggestions on how to improve this blog.


Showing posts with label 3d. Show all posts

Saturday, April 18, 2015

rollover watch

$GC higher time frame on roll over watch.
After the potential for a 3d long criteria waned (losing steam at the weekly 50MA and monthly 20MA) we have the potential for a breakdown


Similar to the way $HG behaved to start 2014.  Monthly time frame set up the potential for a 3d criteria long position but continued to see rejection from the 20MA, rolling-over through support

Thursday, December 4, 2014

GC monthly

Potential 3d criteria setup on the GC monthly time frame.  Looking for the weekly fast line to turn positive.

Monday, October 27, 2014

Copper 3d setup

3d criteria setup on the HG daily time frame.
Primary target is back to previous resistance and through the daily 50-day MA ($3.1055).

updated

Wednesday, February 19, 2014

2b

Hard not to be non-committal just ahead of FOMC minutes, but the IMF headline certainly shook things up.
Here's a look at the 30-min SPY.  The 3d criteria setting up the long and the 2b criteria setting up at prior highs (1-cent above previous, January, highs).

Nothing overly bearish at this point, especially considering the recent run up.  The hourly turning negative can preclude some faster time frame short setups, however, it would be preferable to wait for the fast line to tick higher then continue lower (XYZ wave) for an entry on that (hourly) time frame.

As an ammendment to the above 30min chart:
This still has potential to break out from the $184.70 base.  If that's the case, the current 30min 2c criteria would be actionable with a faster time frame (10-min below, right) going from 3d criteria to 3a (or 1a).

{updated}
Support gave way, turning the faster time frame 3d criteria into a 4c continuation and turning the higher time frame (30-min) 3/10macd fast line back down lower after a tick up.

Wednesday, February 12, 2014

TLT

While watching for reactionary selling in the indices there was a reasonable justification to watch for the inverse in TLT.
The 3d criteria setup on the "trigger"(hourly) chart was looking good for a potential long entry, however, price ended up rolling over and triggering a short entry

Thursday, January 30, 2014

potential longs

A couple of long entries worth a try on the higher time frame off of a 3d criteria setup on the hourly.
QQQ was the first to trigger a potential entry on the higher time frame.  First target 86.95, +$0.55 from entry bar.

SPY

IWM


Monday, January 20, 2014

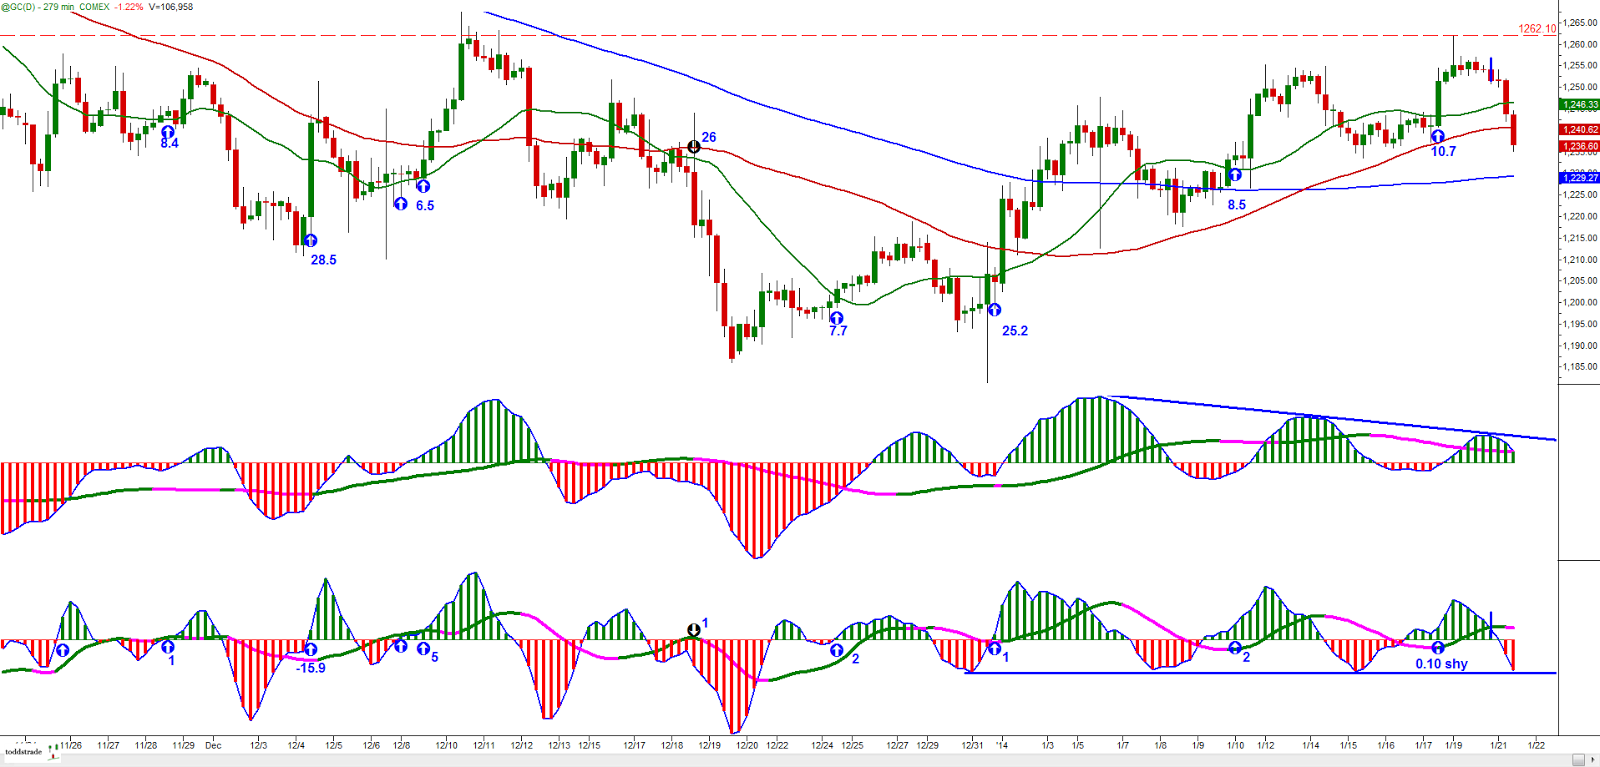
GC

Updated chart from the ones below, to show the fast line/slow line cross providing a warning if long

Actually a bit surprised that Gold continues to squirm higher.
The daily is putting in fairly symmetrical cycles and is at a point where one side will show their hand and we'll see if bulls or bears are stronger here.  The bulls have a double-bottom on their side, while the bears have everything else (moving averages, trend lines, and overall trend).

The 4-hour came so close to it's initial target.  It still has an opportunity to achieve it, but it can be sketchy holding a position on a fairly late entry so close to resistance (a for sure exit would be the fast line/slow line cross on this time frame's 3/10macd (lower subset indicator).

a better look at the cycles

Wednesday, January 15, 2014

CL

Crude update coming off of the 4-hr 3d criteria setup.  So far achieving 2R target

Tuesday, December 10, 2013

GC

Potential long entry trigger in Gold today.
On the weekly (below, left) and daily (below, right) today's close marked an entry in anticipation of the weekly time frame buy divergence playing out.

A little faster time frame; Daily (below, left) and ~4-hour (below, right) had a really nice 3d criteria setup and really nice R:R entry.  Primary resistance to deal with is the 1289 area.
The momentum on the 4H chart is pretty solid, and though the main trend is still solidly negative dip buying seems reasonable from here and back into the 1230 range.  Under 1230 could see a failed move turn into a fast (bearish) move.

An even higher time shows a clearer picture of the monthly chart potential for a '3-pushes to a low' setup to play out

Monday, October 14, 2013

CL setting up

Crude weekly/daily time frames look to be setting up a long entry.

Criteria 2c-2d on the weekly (with bullish trend) we would like to see a 3d criteria setup on the faster time frame, which in this case is the Daily (below, right).  A long entry "trigger"would occur when the daily time frame registers a positive fast line reading (turns green, which would be 3a criteria).  Look for momentum and follow-through to confirm.


Thursday, August 1, 2013

Thu 08_1

Resistance overhead?  Just gap over it!
 A key for the above (5-min) chart to define the horizontal lines and dots.  For further explanation, see this link:  

Arrows on higher time frame indicate anticipatory trades that are entered using the faster time frame.

ES_with globex;  best entry was 10-min prior to Open; arrows indicating potential entries (no exit signals are indicated)

HIgher time frame; Daily (below, right) had 2c-2d criteria, entry was 3d-3a criteria setup on faster time frame

Thursday, July 18, 2013

thu. 07_18

As mentioned in my last post:
 and


Here's how it played out; with the 2c-2d criteria we're looking to buy the 3d criteria on the faster time frame


The initial buy was on the close of the 16th.  Additional up-arrows (on the 17th) represented potential adding entries.

Thursday, July 11, 2013

July 11

Been a while since posting.  The time invested isn't returning enough interest to really motivate me to continue on a regular basis.  I'll probably just throw some charts up here and there when I can.
Here's where we stand on the SPY.  Narrow daily ranges vaporizing higher.  We either break out further or return to test a previous pivot, that's how this game works.  Either we follow price breaks higher or we follow the ensuing pullback and look to buy the next 2c-2d criteria on the 3/10macd (65-min time frame)

Previous higher time frame 2c-2d setups (3d faster time frame entry trigger)
From June 28 (First shaded region on the left 65m chart)

From July 2/3

From July 10/11 - cute how price broke out after FOMC minutes, came back to sweep up the stops at the $164.70s pivot and then triggered long on the closing bar (at a cheaper price)

Friday, June 7, 2013

Fri 06_07

Momentum day, though didn't have the same sort of Advance/Decline internals you typically see on an extreme advancing day.


Higher time frame - bulls need it to push through that $165 - $165.50 area

ES with globex - overnight range midpoint (also 50% retrace of previous day's close to today's Open) held on the opening retrace, Overnight high held as afternoon support.


Another look on multiple time frames

Thursday, June 6, 2013

Thu. 06_06

Choppy fu*$%ng chop.  End of day was more pleasant.  Was buying in the morning because of the 3d criteria setting up on the 15min.  The shakeout was interesting.

Breadth

Higher time frame

The buy divergence setting up on the higher time frame (65min) we'd be looking for a 3d or 3d setup on the 15-minute, like below, it got choppy but you had to stick with it, you're not going to catch any fish if you don't keep casting your lure.

ES with globex and potential entries

Saturday, May 11, 2013

Dollar 3d

Update on the weekly time frame 3d criteria (shaded in the chart below, left) setup that took place on the U.S. Dollar Index at the start of this year.
The daily showing potential "trigger" entries (one of which "failed" where price reversed and made a lower low).
 Watching for potential breakout over $83.70

Wednesday, May 8, 2013

BIDU 3d

I've been watching BIDU here and there, watching for the higher time frame 3d criteria setup to develop (shaded area in the chart below, left).
I thought this would be a good example to profile because of the difficulty which the "triggers" proved to be.  The important consideration for this setup to exhibit is strength in price recovering a significant market structure high (look left for pivots).
The Blue up-arrows (on the 15-min chart below, right) are potential long entry "triggers".  The black down arrows are instances where the fast line and slow line cross, which should be an "at most" stop out metric.  The blue trendlines and horizontal line at $86 indicate significant pivots for price to take out, so when you see an up arrow, look to the left and see which pivot that price needed to close above.
There were some short entries to consider, but I wanted to focus on the 3d criteria setup.  Of the 5 potential entries, 2 were scratches and 2 averaged both a $0.50 loss per share (which could have been helped with shorting the failure of the setup.  That is, had you waited for the fast line and slow line cross to tell you to get out, depending upon your comfort with reading price action, some of these trades could have been managed for better results.  So, at wost, you may have lost $1/share but currently be in a position with an approximately $6/share reward

Potential triggers after the jump:

Friday, April 12, 2013

Fri 04_12

Last trade of the day is missing a down arrow for a secondary exit which was taken in the last 5-min bar.  There is also a short in here that's not marked around the 13:20 hour.

A key for the above chart to define the horizontal lines and dots.  For further explanation, see this link:  

Opening Swing and first hour's trade - 50% level reflected from the pre-market range

ES with globex - looks like an ascending triangle into the close, which can go either way, but whichever way it breaks you trade in that direction.

Volume profile - price finding support at a previous (2-days ago) Low Volume Node

Breadth - fairly bearish all day.  

SPY Cycle update - there is still potential for this to be the midpoint of a measured move higher