

Saturday, July 31, 2010
just a chart
SPY 30-min with an Andrews Median Line (red lines), sliding parallels (dash teal color), and a Warning Line (solid teal trendline) being that price has failed to touch the mid-line.
Friday, July 30, 2010
AKAM Falling Three
The Bearish Falling Three Methods has been seen before on this weekly chart: Previously, after forming the pattern, price retraced 62% before the continuation move followed:
 It would make sense in this case for price to attempt a test of the earnings miss clear air

 Previously, after forming the pattern, price retraced 62% before the continuation move followed:
 It would make sense in this case for price to attempt a test of the earnings miss clear air
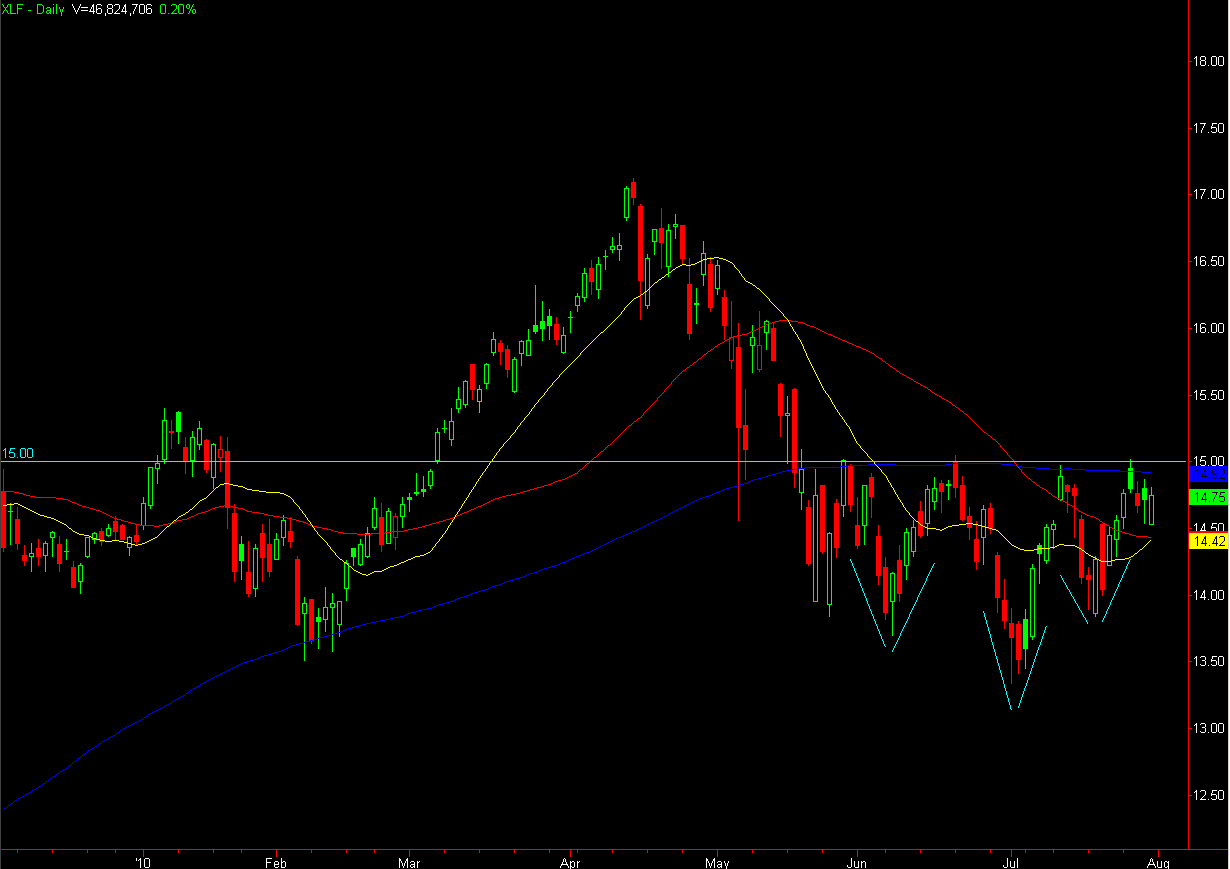
XLF
XLF looking interesting here within a range. Should price continue tracking towards $15 a strong breakout may occur


Thursday, July 29, 2010

a recurring theme
On the heels of a previous post...Short setups in RIMM and FCX
First, we have an established range with S/R which will give us potential targets on the breakdown move (also worth noting, the overhead Supply in this case is an earnings miss gap down): We get a few bounces off of support, only to see buying interest wane before the breakdown:
Same situation in FCX

How fast the tide turned: RIMM ended the day in a long-legged doji after tagging it's 50-SMA

First, we have an established range with S/R which will give us potential targets on the breakdown move (also worth noting, the overhead Supply in this case is an earnings miss gap down):
 We get a few bounces off of support, only to see buying interest wane before the breakdown:
Same situation in FCX


How fast the tide turned:
 RIMM ended the day in a long-legged doji after tagging it's 50-SMA
I'm not buying it, you buy it...
Following POT earnings we saw a price liftoff on strong volume, only to see the move faded once hitting that overhead supply range ($100-$101). Have we noticed a theme yet of beat earnings moves being faded??
At any rate, here's the overhead supply zone as posted last night: Following a failure test of the highs, price formed a seed wave, giving 2 primary targets. I'll post an end of day update on this chart
 It's a funny thing to see strong buying (as evidenced by the green volume bars) into a move, but the overhead supply concept will win out every time (initially anyway, this could be a mechanism to flush out "weak" hands and we could base and consolidate between this $97-$100 range for a while longer, it just depends on how much demand there is).
...should have bought it...what a move!
At any rate, here's the overhead supply zone as posted last night:
 Following a failure test of the highs, price formed a seed wave, giving 2 primary targets. I'll post an end of day update on this chart
 It's a funny thing to see strong buying (as evidenced by the green volume bars) into a move, but the overhead supply concept will win out every time (initially anyway, this could be a mechanism to flush out "weak" hands and we could base and consolidate between this $97-$100 range for a while longer, it just depends on how much demand there is).
...should have bought it...what a move!

Wednesday, July 28, 2010
POT pre-earnings
The daily shows:
- Price above the 20- & 50-SMA, but below a slightly up-ticking 200-SMA
- Price within a $8-$10 range for the better part of 2.5 months now
- First trend-line break (from a strong selling phase) broke out and retraced all the way back to its trend-line.- Second trend-line break is in progress
- Highest volume day for the past 8-sessions ended selling off from it's highs, but still closed above the open.
- A strong gap up could meet with resistance at the overhead 200-SMA
- A downside gap could have support at the 20-SMA area, $93-$94
 While intra-day:
- Approaching earnings, price has been bought up into an accepted range, between $95-$99.
- This past week has seen a number of sell-offs (probably a sign of covering positions before earnings?) that quickly recovered, while putting in 3-successive higher lows.
- Bulls and Bears are positioned. They met in an accepted range, and the winners/losers will be told through the tape in the morning.
 Minor S/R levels include:
short setup
Along the lines of a previous post, here's a similar setup in VMW today:
Price is within a range with established Support/Resistance levels
 Price broke down once buying interest waned, ideal entry is on a mini bear flag
 end of day update
Price is within a range with established Support/Resistance levels
 Price broke down once buying interest waned, ideal entry is on a mini bear flag
 end of day update
Crude Median Line
Price failed to tag it's Andrews Median line in Crude today. IF price breaks down from the Lower Median Line we could watch for a potential target/support via the pitchfork's warning line (red dotted line):


Tuesday, July 27, 2010
links
Links to all the trading blogs you could ever want to read can be found on the MarketRoll site (first one to the left). I've found that I just don't go blog-hopping anymore and figured that if people come to this site as a conduit for other sites they could just as easily bookmark the MarketRoll link in their browser's toolbar and save themselves some time.
If you have a compelling argument which you think might change my mind, by all means let me hear it.
If you have a compelling argument which you think might change my mind, by all means let me hear it.
Monday, July 26, 2010
failed short
Shorted JOYG and got stopped out, but I still love this pattern where you can just see buying interest just die.
The Support-turned-Resistance zone was working early in the day, but the more it comes back to test it and the more the buying interest wanes, the higher probability it will break down from support. I entered on a little bear flag setup and got whipped out (stop too tight), had I stuck with it I can see the potential of where I would have gotten back in with much cleaner price behavior within the later bear flags at support
The Support-turned-Resistance zone was working early in the day, but the more it comes back to test it and the more the buying interest wanes, the higher probability it will break down from support.
 I entered on a little bear flag setup and got whipped out (stop too tight), had I stuck with it I can see the potential of where I would have gotten back in with much cleaner price behavior within the later bear flags at support
SPY midpoint
The SPY is exactly half way between the April 2010 highs (give or take a few pennies) and the June 2010 lows (+/- a few pennies), and 0.72% down on the year so far. Amazing that it has taken 45-days from high to low and only 16-days from low to midpoint. While it took 10-days from midpoint to lows.
 Possible bearish scenario is the overhead 200-SMA with a bearish Wolfe Wave setting up
 Possible bearish scenario is the overhead 200-SMA with a bearish Wolfe Wave setting up
RIMMinent
A breakout or breakdown looks imminent in RIMM from here:
Get in on the breakout/down, or wait for the first pullback.

Get in on the breakout/down, or wait for the first pullback.

Sunday, July 25, 2010
FCX cont.
Recent updated chart. Worked nicely. Looks to me like a correction of some sort could be expected for the early part of this coming week.
updated from here
FCX reports tomorrow morning at the open.
So far, it has had this nice channel setup, where the breakout cycle is similar to a shoulder (61.8% retracement of the previous cycle): The larger picture is still down for now

 Price is currently right up against the 50-MA with the 20-MA just below
intra-day S/R:

updated from here
FCX reports tomorrow morning at the open.
So far, it has had this nice channel setup, where the breakout cycle is similar to a shoulder (61.8% retracement of the previous cycle):
 The larger picture is still down for now
 Price is currently right up against the 50-MA with the 20-MA just below
intra-day S/R:

Tuesday, July 20, 2010
TICK extreme
Another NYSE TICK extreme off of a previous post {here}
Going back as far as my platform allows, TICKs greater than 1600 and weaker than -1800 are few and far between. Recently, we've had two TICKs > 1600 (today was one of them) in the last 4-days. While the "flash crash" was the lowest TICK reading in over 12-years.
 curious
Going back as far as my platform allows, TICKs greater than 1600 and weaker than -1800 are few and far between.
 Recently, we've had two TICKs > 1600 (today was one of them) in the last 4-days. While the "flash crash" was the lowest TICK reading in over 12-years.
 curious
Monday, July 19, 2010
FCX at 60
$60 is an important level on FCX. This weekly has bounced on two occasions in the past 2 months, but buyers are seeming less and less interested.
 We bounced from there again today, but the lower highs scenario is in control
 We bounced from there again today, but the lower highs scenario is in control
updated
From yesterday's post. The first scenario played out closer than anything...Big buyer's aren't stepping up unless there's an earnings catalyst.
Price gaped down slightly, made a push to test the previous day's swing high, but a failure printed a lower high, leading to selling throughout the day.
Price gaped down slightly, made a push to test the previous day's swing high, but a failure printed a lower high, leading to selling throughout the day.

Sunday, July 18, 2010
POT breakdown
A look at POT Support/Resistance levels going into the week.
It has spent a lot of energy getting back into an accepted price range and the faster it gets to $100-ish (if it goes that direction) the quicker it may be repelled lower.
The following chart shows great examples of support-turned-resistance and other classic technical patterns, so if nothing more, this chart is good to have on here just for posterity: A faster timeframe;
Following a test of $96 support the last few candles were a pennant breakout pattern.
So, scenarios ahead are:
- $96 support broken on Monday could be a sign of weakness, but in such a case $94.50 could easily be support for a re-test of $96 (support turned resistance).
- A gap up early into $98-99, which will either confirm the pennant breakout, or lead to a pennant breakout failure. If the former, $100-101 is resistance (and measured move), If the latter, refer to first scenario.
- A mild gap either way, met with dips being bought into $100-101.
It has spent a lot of energy getting back into an accepted price range and the faster it gets to $100-ish (if it goes that direction) the quicker it may be repelled lower.
The following chart shows great examples of support-turned-resistance and other classic technical patterns, so if nothing more, this chart is good to have on here just for posterity:
 A faster timeframe;
Following a test of $96 support the last few candles were a pennant breakout pattern.
So, scenarios ahead are:
- $96 support broken on Monday could be a sign of weakness, but in such a case $94.50 could easily be support for a re-test of $96 (support turned resistance).
- A gap up early into $98-99, which will either confirm the pennant breakout, or lead to a pennant breakout failure. If the former, $100-101 is resistance (and measured move), If the latter, refer to first scenario.
- A mild gap either way, met with dips being bought into $100-101.

Saturday, July 17, 2010
charts to look at
Symmetrical cycles in FCX, potential rounding base. Also, potential 3-pushes to a bottom (bullish wolfe wave) setup:
POT broke out of an intraday pennant on Friday. Measured move is only a retest of the $98-99 range. SPY levels
 Most recent SPY pitchfork setups
 RIMM, $52 has price support which coincides with a 50% Fib. retracement, but under that A LOT of clear air


POT broke out of an intraday pennant on Friday. Measured move is only a retest of the $98-99 range.
 SPY levels
 Most recent SPY pitchfork setups
 RIMM, $52 has price support which coincides with a 50% Fib. retracement, but under that A LOT of clear air

Friday, July 16, 2010
One chart to rule them all...
AAPL today during the press conference, short squeeze followed by a resumption of trend.
A chart to save for the scrapbook.

A chart to save for the scrapbook.

retrace
SPY retraced 38.2% from July 01 lows to July 13 highs IWM much less of a bounce on the way up, and much more selling on the way down, retracing 61.8%:

 IWM much less of a bounce on the way up, and much more selling on the way down, retracing 61.8%:
Subscribe to:
Posts (Atom)