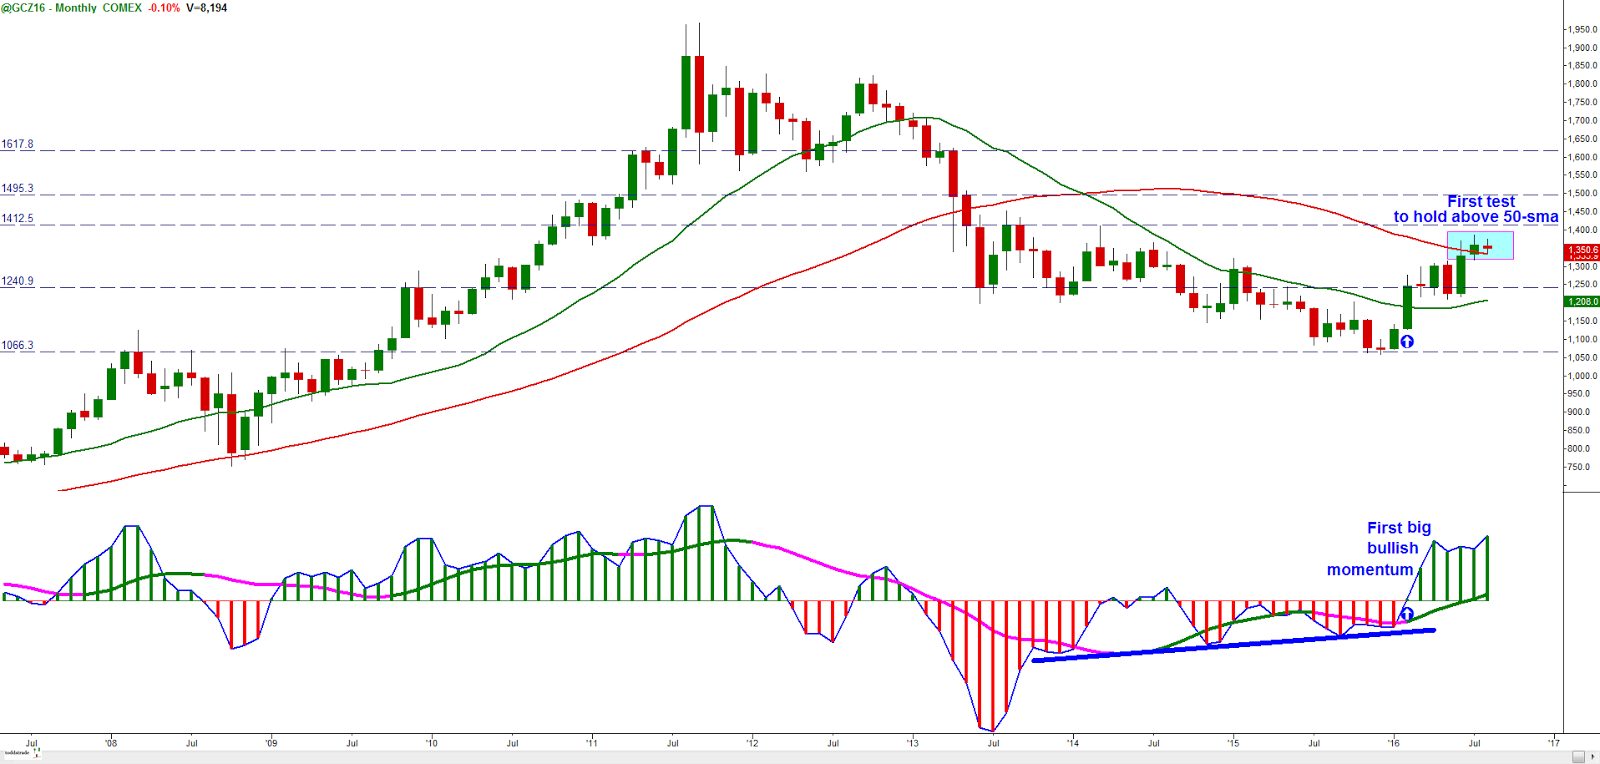
Monday, November 9, 2009

rinse and repeat

Another gap-up and low volume short squeeze. What is this, the fifth one now? Updating yesterday's chart of the Fib. extensions, here's where we stand:We gaped above the 138.2% retracement and closed above the 150%. Next stop, new '09 highs and the 161.8% level.
Today's volume was just pathetic!The Dow led the way today and finally looks ready to test the Lehman-Gap levels, which happens to be 50% retracement resistance

Wolfe Wave

I just started reading up on Wolfe Waves, so I wasn't fortunate enough to catch the most recent setups, but they present interesting potential to look out for. I'll provide a bunch of links at the end of this post that you could explore on your own, so I'm not going to go too in depth. I'll just present some basics with the setups that I recently saw develop. Essentially, a Wolfe Wave is an ascending/descending wedge. For the following examples I am using a Bullish Wolfe structure, the concept for the Bearish setup are simply reversed. There are 5-points to a Wolfe Wave which are broken down as follows:
Point-1 is a swing low
Point-2 is a rally off of Point-1
Point-3 is a lower low compared to Point-1
Point-4 is a lower high compared to Point-2
Point-5 is likely to exceed the trend line of 1-3, it is also the entry point for your trade
We start by connecting points 1-3 and 2-4
We could then duplicate the parallel 2-4 line and extend it off of Point-3. This will give us the "sweet spot" where we might expect Point-5 to extendNext, extend a line outward which connects points 1-4, this gives us our EPA (Estimated Price at Arrival)
Finally, we can extend the parallels drawn off of 2-4 & 1-3, find where they intersect and we get our ETA (Estimated Time of Arrival). The ETA is not a hard and fast projection, and should not be used as a basis of staying with a trade.
Some points to remember:
-Watch the 3- & 4-point for resistance and potential failure of the move
-Wolfe Waves typically develop after a trendline is broken
-Look for relatively strong volume on the 5-Point

As you can see above, GS formed a Wolfe Wave on the 30-min chart and fell into the "sweet spot" on Nov. 2nd. Here are a couple more examples:Here are a ton of links (thanks to an amazingly comprehensive and efficient friend) to learn more about this setup:
http://www.marketcalls.in/2009/03/wolfe-wave-pattern-in-nifty.html
http://tryin2trade.blogspot.com/2009/09/nf-hourly-chartwolfe-wave.html
http://forum.as-1.us/viewthread.php?tid=4024&extra=page%3D1&page=1
http://beginnertrader.com/blog/technical-analysis/trading-with-wolfe-waves
http://www.gold2gold.com/webboard/index.php?topic=157.0
http://www.traderslaboratory.com/forums/56/wolfe-wave-indicator-needed-2686-3.html
http://blogs.fxstreet.com/forexology/2009/05/21/managing-the-wolfe-wave/
http://www.voodootrader.com/ta_5.htm
http://chart.nu/ta_3.htm

Sunday, November 8, 2009

Deep Retracement

Snap a Fibonacci Price Retracement line between obvious swing highs and lows. The typical levels watched as potential Support/Resistance are the 50%, 61.8%, and 38.2%. While the typical "external" projections include the 150%, 161.8%, and 138%. But another, less used, level is the 78.6% retracement. This often overlooked level is important to watch during deep retracements. We see this deep correction over and over again, and how many have actually traded on the wrong side of the market because price nearly gave up all of it's previous move?
Take a look at some of these charts and the 78.6% retracement they all have in common. We don't have to go back far to see them in action; here's Friday on the 5-minute chart:While it looked like selling was going to send prices back under the lows of the day support was found, a higher low was established, and price never came back to this support zone. Used in conjunction with a momentum oscillator we could have been suspecting a reversal at this level.
What's even more interesting is what we've seen in the SPY since the swing low of July. After the initial upward momentum impulse, all of the major corrections we've seen found support at (or around) this 78.6% level.After our initial impulse in July we can snap a Fibonacci Retracement calculator from that low to the first obvious high before price corrected. Doing that we can then get projections (known as "external" projections) for where we might expect overhead resistance to occur. Sure enough, price has experienced congestion at these projections and has, so far, extended all the way to the 150% projection (The way Tradestation draws these lines and the numbers you see depend upon where you snap your lines. I choose to draw them from low to high for upward projections. In that case I end up with external projections labeled -50%, -61.8% and so forth. If I were to draw them from high to low I would get 150%, 161.8%, etc. Irregardless, what we're dealing with is a Fibonacci sequence of numbers that extend beyond the prescribed swing low and high).
So, going forward we have a Fibonacci resistance level overhead. While Fibonacci levels may seem arbitrary we can see for ourselves that this 138.2% (-38.2% in this case) coincides with prior levels of congestion and has acted as a pivot between support/resistance levels. A break of this level will be significant and cause us to suspect a move at least back to the highs. Watch this level to see if resistance holds.

Friday, November 6, 2009

scalping day

You never know what you're going to get during the day, but as time goes by the market begins to tell you.
Starting with the SPY gap down this morning (of 0.5%), the low of the day (LOD) was established at (one of) the previous day's support levels ($106.05) and after 6minutes of consolidation we broke higher. A good measure of whether we might expect a gap fill or just a weak handed attempt at the fill is to snap a Fibonacci retracement line from the Previuos day's close (PDC) and the open low (vice versa in a gap up). Once price broke (and closed strongly) above the 61.8% retracement from these levels we have to assume that the Risk:Reward better favors a long entry to fill the gap. Also, remember the strategy for scalping long on a gap-down that returns to the PDC?
Besides, it's Friday morning, how many traders just want to get a nut in their pocket and take the later afternoon off if we end up range-bound? Why not buy that gap-fill entry on larger size, take 1/2 to 3/4 at the PDC (remaining position at higher Fib. extensions) and start the morning profitable? And it doesn't hurt to have the Vix and TICK trending in your favor.
45-minutes into the day and traders then begin to realize that profits have been taken (is that a nut in your pocket? ;) and this isn't shaping up to be a trend day so far. We're now back to the PDC and TICK is becomming more and more negative.We so far had a nice TICK divergence that either got you out of your initial long position, or got you into a short position (if for nothing else, a scalp back to PDC). So, we sold off in a higher low that was also highlighted with a TICK divergence and we could have even reversed and gotten long for yet another test at that PDC!
We notice by now (and for the rest of the afternoon) that internals are mixed, so we should be thinking "range-bound" and "scalping." We should be thinking "fade" the extremes. By "internals" I mean comparative readings of the Advancing/Declining Issues, Up/Down Volume, TICK, VIX, etc.
The arrows circled throughout this chart highlight entries you could have taken which corresponded with TICK divergences (volume divergences as well). A number of these entry arrows are actually little flag setups, (can you see the flags?? those initial pushes followed by lack of interest in the opposite direction) While a number of the exits were based on moving average support on the higher time frame.At any rate, we slowly creep up in an ever narrowing channel (wedge). Remember what I said earlier about trading for a gap-fill when price begins to work above the 61.8% retracement? How many stops are overhead that could squeeze us up even fruther? Well, we're nearly at that higher probability upside trade, as measured from previous highs and the most recent swing lows:The daily is close to forming a right shoulder, but these H&S patterns were a dime-a-dozen in '08-'09
This week ended in a Harami candle pattern. Next week will be interesting!

Wednesday, November 4, 2009

FOMC smack-down

FOMC minutes today at 2:15, always fun to watch the madness of a Fed day.
First thing of note today was that although a lot of breadth readings (Up/Down Volume, Advancing/Declining issues, etc.) were weighted bullish today, the TICK was experiencing progressively more negative readings than positive the later in the day it got.
Monday and Tuesday saw consolidation into a narrow, upward channel which we gaped above this morning, only to settle right back into the lower channel line by the close (the ellipse on the chart below shows off a "First Cross" short entry trigger).
While the daily SPY shows the 3/10 oscillator's slow line (a.k.a. "Stability of trend" line) beginning to dip into a negative reading (shown by the ellipse), only the second such time since the March lows. Also, we notice that price was rejected at the 20EMA and now rests on top of the 50EMA.
The Russell2000 (represented here with IWM) seems to be the weakest of the bunch at this point, with the 20- & 50-EMA's nearly crossing over.The Dow Jones Transportation Index (represented here using IYT) looks to have taken a bearish stance today, printing a big bearish engulfing pattern at a meeting of resistance of the 20- & 50-EMA's which are nearly beginning to crossover.

Monday, November 2, 2009

indecision

A lot of long-legged doji's and high-wave candlesticks printed on today's daily charts. In other words, the markets seem to be neutral, or in a period of indecision.
A lot of key issues sit right on (or near) key support at oversold levels. Do we bounce or continue down? Notice how all of these support levels sit right around whole numbers, and for the most part, have higher (or nearly equal) swing lows at this point):
AAPL:FCX:GS:
WYNN:
GLD:GOOG:
XLE:XLF:RWR:
IYT:PSI; filled the gap:

Friday, October 30, 2009

pre-Halloween bloodbath

Taking a zoom-in approach to this Friday's SPY auction:
Starting with the 2-min chart with modified NYSE TICK histogram. Selling the Positive TICKS today worked spot on.Keeping it very simple; continued downside was evident after price closed under the 50% retracement (previous day low to high) and later the 50MA. We closed 1% lower than the previous lows.What's ahead? We closed the month with a higher high and, so far, a higher low. To the downside there are conceivably 3 levels of potential support.
After that, there's a lot of empty (untested) space below. A LOT!