The setups I include on this blog are used in conjunction with the 3/10macd and the criteria I ascribe to it as a way to alert me to an existing condition of price. The key concept to take away from this blog is that I try to anticipate what will happen on the higher time frame by using a faster time frame to trigger the trade setup. I do not trade a "system" I use two indicators to clue me in to price conditions. Please read the Disclaimer located in the sidebar of this site. I can be contacted via email at toddstrade@gmail.com
I am always open to questions, comments, or suggestions on how to improve this blog.


Showing posts with label TICK. Show all posts

Tuesday, February 14, 2012

tue. 2_14

Two examples of the 3d setup today.
First, NFLX - impatience led to an early exit

The setup in the SPY into the close today was tricky.  The first entry would have been a stop-out while the second entry was triggered late and right up against one of your targets (50% projection).

The squeeze wasn't THAT much of a surprise (well, perhaps the range of it was surprising, but the anticipation of a sell-off was less favorable) while watching TICK (divergence) at the 2/10 gap fill ($134.38).

Thursday, December 1, 2011

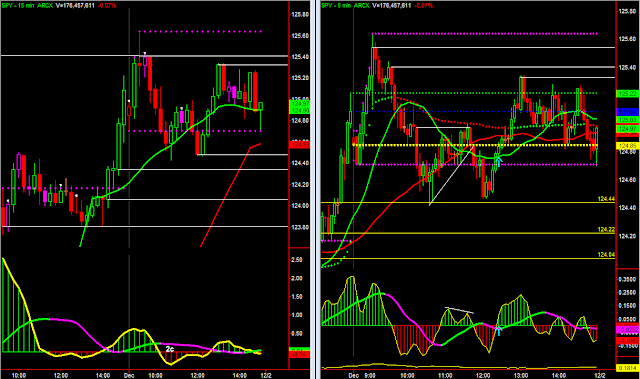
SPY

Moves to the A/D zero-line while fading resistance worked well today.  As the previous day was an extreme advancing day the 124.45 area was a previous day break-out level. 

Wednesday, November 30, 2011

bull squeeze

The day in the SPY as it unfolded.  The vertical lines correspond to buying points on negative TICK readings once the market began to consolidate, but the payoff wasn't very rewarding throughout the afternoon (scalps for 15-25-cents).
I had a resting bid in at $123.86 (corresponding to the 9:30 breakout point) and sold it at IB high only to buy back higher (around vwap) as the market character began to change (forming that triangular seed wave).  The position was taken off in full acci-fucking-dentally! near the highs of the day on an extreme TICK (meant to only take half).  All-in-all an extremely disappointing performance today on a day that rewarded patience.

Tuesday, November 29, 2011

Review

Continuation move off of the previous day's late afternoon momentum.
Some points to observe:
1). Opening gap-fill followed by a rally, notice how the A/D pulls back to the zero line, finding support.
2). First failed higher high & low on a waning TICK & A/D line.
3). Price pulls back to vwap on an extreme negative TICK reading (also coinciding with a 50% retracement of the opening momentum, as well as a pullback in the A/D line to +200 support, which is a bit better than neutral, a moderately bullish breadth. 
4). Price attempts to extend the rally but fails at the initial lower high's breakdown point.
5). A higher low for both price and TICK at vwap (which coincides with a previous higher low & breakout point).  Also continued support at the +200 A/D line leading to a triangle in price.
6). Triangle fails to break higher and A/D line fails to hold support (which then turns to resistance).  Leading to an A-B-C corrective wave.
7). Lower lows in TICK higher lows in price.  A seed wave forms on a +TICK divergence (support at the A/D zero-line as well).
8) Price rallies higher to test upward breakdown levels (shorts covering as a higher low becomes more confirmed).  Also, the A/D line runs back to +200 where it pulls back off of (on an extreme +TICK reading), then attempts to break again, but fails.  Price settles nearly to the penny of where it opened.  Nothing gained, nothing lost and yet consisting of so much drama.


Thursday, November 24, 2011

trend

One of highest probability trades out there;  entering on a pullback of strongly trending price (I added the ADX in there to show the degree of trend in case it's not obvious from the Moving Averages, but it can be useful as a component for an intraday scan).
The vertical lines on the 5-min chart indicate possible triggers to entry (if you need an indicator for that) or for a more aggressive entry, one could fade a red fast line reading on the 5-min.   The best entries coincide with a pullback to the origin of the breakout (notice the large reverse divergence on the 5-min chart).
Of the 4 vertical lines (entries), only 1 would have resulted in a loss or break-even trade.  The third entry never hit the ATR stop placement. 

The SPY didn't have as strong of an ADX reading as that of TLT but still provided the same concept as that above.  Look to fade higher price (green fast line)

But look to fade it in an area that corresponds with what can be considered a resistance level or overbought conditions (extreme TICK).
As the fast line goes green the first time a test of vwap corresponded to a new TICK high which was faded (though the payoff was a higher low).  The second push higher tested the 9:15 breakdown point on extreme TICKs and went to test the lows.

As an aside, I did take the 3d long entry towards the end of the day.  Price went beyond my stop by 4-cents before hitting both the 50% & 100% projections (though be it in a very choppy move).

Monday, November 21, 2011

Extreme bearish sentiment from the Open. Was a tough day.  All I have today is hindsight and these two charts.
A really good example of a Price/TICK divergence off of the 10:30 (CST) lows.  Also, extreme +TICK readings were good for fade scalps up until the sentiment shift.

And the sentiment shift occurring at noon on volume which compared to that of the earlier lows.

Friday, November 4, 2011

repeat

Similar market behavior as the previous day where fading extreme negative TICK readings (-800 with volume support) throughout the day worked well.

Gap-down selling found support (again) at the previous week's Open, coinciding with a demand level from the day before as well as a 100% projection off of the gap (previous day's Close to today's Open).
Earlier in the week I highlighted the 2c setup and the reverse divergence, which is what we got this morning.  Notice how the 5-min 3/10 macd forms a 3-push divergence and then triggers a 3d setup giving us a seed wave.

Thursday, November 3, 2011

Gap Fill Squeeze higher

This has all happened before, it will all happen again. We get a jolt of volume which is followed by a steep rising wedge/channel higher.
A nice gap-fill in the morning followed be a market with zero selling pressure.
Every pullback in the TICK to -500 or lower was a buying opportunity (bottom histogram is just a smoothed indicator of the TICK).

Friday, October 21, 2011

strong sentiment

Very active pre-market
SPY

ES_F


A good setup for the strong sentiment day is to fade the extreme TICK
Notice either a new low TICK or a New low TICK combined with a price divergence.  The first example illustrates where price made a lower low on a higher TICK (at vwap).  Finally, look to play the little cup/handle pattern breakout

Tuesday, April 14, 2009

holding on

SPY gapped down this morning within 10-cents of yesterday's opening gap down price. After finding support at S1 we got a dragonfly doji followed by an nr7 up candle on top of vwap (don't you love having a confluence of reasons to take a trade?). We did manage to fill the gap (which coincided with pivot resistance), but that was about all we managed. From there it was all downhill. Later in the afternoon was an utter mess with a broadening wedge that will drive you nuts. At 4-p.m. the SPY closed just under the gap-up low from Thursday last week. As of 4:15-p.m. price is back about that level (shake out?).
We did put in some lower highs and lows today, and the 20- & 50- EMA's have crossed over bearish. However, price hasn't liked that orientation lately, so we'll see if it tries to shake off that bearishness tomorrow.These empty spaces we're being left with (a-la opening gaps) are being guarded closely.
This afternoon's attempt to fill the gap left from Thursday resulted in sideways consolidation with a meagerly bearish TICK. While at the end of the day the TICK gave it's lowest reading of the day and price put in a higher low (on extreme volume) and turned back up towards the opening range low. Price is not giving up without a fight.
Compare that to early last week, where TICK sentiment was certainly bearish, but price refused to go any lower. You have to wait for price to tip it's hand with certainty. Maybe Intel earning's will put a strain on things?

Wednesday, April 8, 2009

demand in that range

In these past two days we have tested the gap left from last Thursday on the SPY ($81.50-$82 range) with, what looks like, increasing demand. When price was in that range we have also seen the NYSE TICK react in a way that gives me the impression that offers are being lifted with increasing interest.
Yesterday, as we gapped down into this range we saw a bullish divergence in the NYSE TICK, leading price higher. Later in the afternoon yesterday, price was very range-bound at these lows while TICK couldn't drag price any lower. This morning we found ourselves back in this range while the TICK again acted in a bullish manner, while this afternoon price V-bottomed when the TICK tagged those negative boundaries.This morning gave us a cup w. handle setup and two "First Cross" entries (green and red vertical lines). The long "First Cross" entry coincided with a retest of the break from the cup and handle breakout (price broke out from the cup's rim, came back to re-test the rim's price and continued the measured move).The 15-min chart shows the refusal of price to close the gap left from last Thursday. The 20- & 50-EMA aren't giving up their bullish orientation.It looks as though the bulls have successfully turned back any further bearish retrace. It would seem testing the upside is desired from here.

Thursday, March 26, 2009

chop fest

A very choppy and confusing day (for me). The initial gap-fill attempt (on SPY) showed some dull volume while the TICK didn't get overly bearish. We got a little inverted head-and-shoulders pattern, but buying the neckline break of the pattern would have tested your patience all through the day.While most of the day was spent in a narrow range channel, there were clear examples of support becoming resistance and resistance becoming support.
In keeping a watch for the "First Cross" strategy, there was a long entry that was given at the first opening candle (so perhaps you could have just waited for a pullback from that level, which would have gotten you in at the early morning double-bottom). While the short entry towards the end of the day (red vertical line) didn't work out. However, notice that there was a "Slingshot" setup where price makes a higher low (in this case it was very marginally higher, almost a precisely equal low) and our momentum oscillator makes a lower low (lower momentum unable to drag price lower), which results in a "slingshot in price.The 15-min chart rode the mid-line as resistance all day long.The S&P500 is at an interesting area, where it looks like it just wants to tag 850 just for the heck of it.Do we get resistance from the trendline, or do we break it and get support?