The setups I include on this blog are used in conjunction with the 3/10macd and the criteria I ascribe to it as a way to alert me to an existing condition of price. The key concept to take away from this blog is that I try to anticipate what will happen on the higher time frame by using a faster time frame to trigger the trade setup. I do not trade a "system" I use two indicators to clue me in to price conditions. Please read the Disclaimer located in the sidebar of this site. I can be contacted via email at toddstrade@gmail.com
I am always open to questions, comments, or suggestions on how to improve this blog.


Showing posts with label z-day. Show all posts

Thursday, April 4, 2013

Thu. 04_04

today's trade
A key for the above chart to define the horizontal lines and dots.  For further explanation, see this link:  


Breadth - neutral to bullish most of the day, strengthening into the close

SPY with premarket


Intraday SPY

Opening Swing and First hour of trade

Neutral Inside day

Updated higher time frame charts from previous post...the bullish development began taking place into the end of day, but there is still the chance of price rolling over bearishly


Wednesday, March 6, 2013

Wed 03_06

today's trade
A key for the above chart to define the horizontal lines and dots.  For further explanation, see this link:  

z-day

higher time frame achieved the 50% projection of the most recent seed wave.

Now a matter of watching how the current move is digested following the 2c-2d-1a breakout on the daily

Some comparable examples of this setup in the past; strong momentum coming out of the 2c-2d criteria breakout:
First thing we'd like to see is the faster time frame fast line and slow line of 3/10macd to catch up to one another, being cautious of any XYZ zig-zag waves forming.

We would also like to see the Daily chart 3/10macd to retain a fast line > slow line criteria

More recently we had a similar setup to start the year.  Being that price is quite stretched at this point it would make sense to pull in or catch up to the daily 20-period moving average.  Such a scenario would likely open up a buyable entry and it would be what follows that will determine continuation or further correction.

Monday, February 11, 2013

Mon 02_11

today's trade
A key for the above chart to define the horizontal lines and dots.  For further explanation, see this link:  

Week of OpEx typically has days like today (choppy).  Being that it was the day after an extreme advancing day compounded the choppy environment.
Gave up up the last long trade for a scratch seconds before it went back to the p/m_midpoint (and PDH).

Higher time frame gave a buy trigger.  Weak momentum will not be tolerated at these levels.


Tuesday, November 20, 2012

Tue 11_20

Slight continuation of the previous day's momentum to start the day.  A bit of a panic move on a Bernanke statement, otherwise closing right around resistance.
5 trades; 4 long, 1 short.

The day's trade;
A key for the above chart to define the horizontal lines and dots.  For further explanation, see this link:  

$139.50 looking like the next immediate level of resistance, while the 20-day moving average is around $139.87

Friday, August 17, 2012

day after trend

The day following a trend day typically spends a lot of time (if not all day) within the previous day's upper range (typically the top third of the previous day's range).   It is often not a day to expect much from counter-trend moves and also an environment best left for scalping.

Keep in mind: the sub-chart of the TICK has a number of horizontal lines; zero-line being teal colored, + & - 500 = neutral zone green or red dash lines, + & - 800 = general bullish/bearish are solid green or red, and + & - 1000 = extreme bullish/bearish are a green or red horizontal line.
Notice that today's TICK only got down to barely -500 which is very bullish.

Below is a chart of the SPY with TICK, the numbers 1-5 indicating setups one might look for:
1). The first higher low which followed a new TICK low, notice the strength of the green bar which cemented the higher low.
2).  Profit taking at resistance on a negative TICK divergence.  Notice the lower wick on the red bar under the "#2" indicating the profit taking sellers which follow this methodology.
3).  Price tests support on a new TICK low which is faded.
4).  Price re-tests resistance and breaks out,  but on a negative TICK divergence (harami reversal bar).
5).  Price tests support on lower TICK lows (reverse divergence), the strong reversal bar which followed giving a strong follow-through move in the last 15-30 minutes back to the Open price on a new TICK high (wherein profits were taken into the close, as is evident by the long selling wick on the last 5-min bar).


Thursday, December 1, 2011

SPY

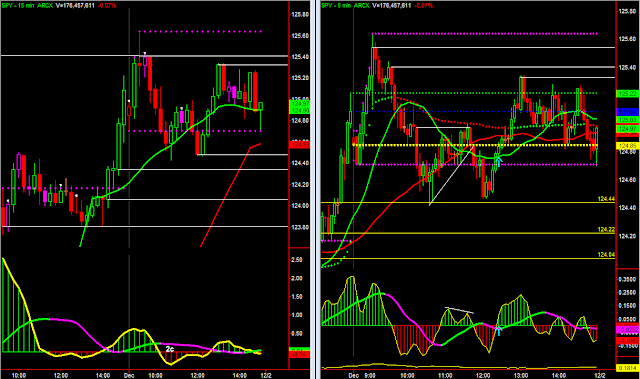
Moves to the A/D zero-line while fading resistance worked well today.  As the previous day was an extreme advancing day the 124.45 area was a previous day break-out level. 

Tuesday, July 5, 2011

not much

Inside day following a trend day, not much going on.

Decent long entry after the 10am low off support (3d setup on the faster time frame) exits were premature.

Other than that, there was a 3d setup in ANR for 30-cents.