
15-min:
Down trend lines broken and price returned to the higher time frame down trend line. The 3/10macd indicator showed a three-push pattern which price was breaking out of into the close on Friday. The gap down this morning negated the bullish setup (and probably trapped some longs), but by the end of the day the momentum was waning into the selloff, creating a momentum buy divergence. The ensuing short-covering on any whisper of news coincided with the shorter-term trend lines being broken.

5-min
The triangle breakdown was choppy, occurring on two buy divergences. The "news rally" short covering momentum broke out from the trend lines and a 50%-61.8% retrace held as support before continuation (seed wave).

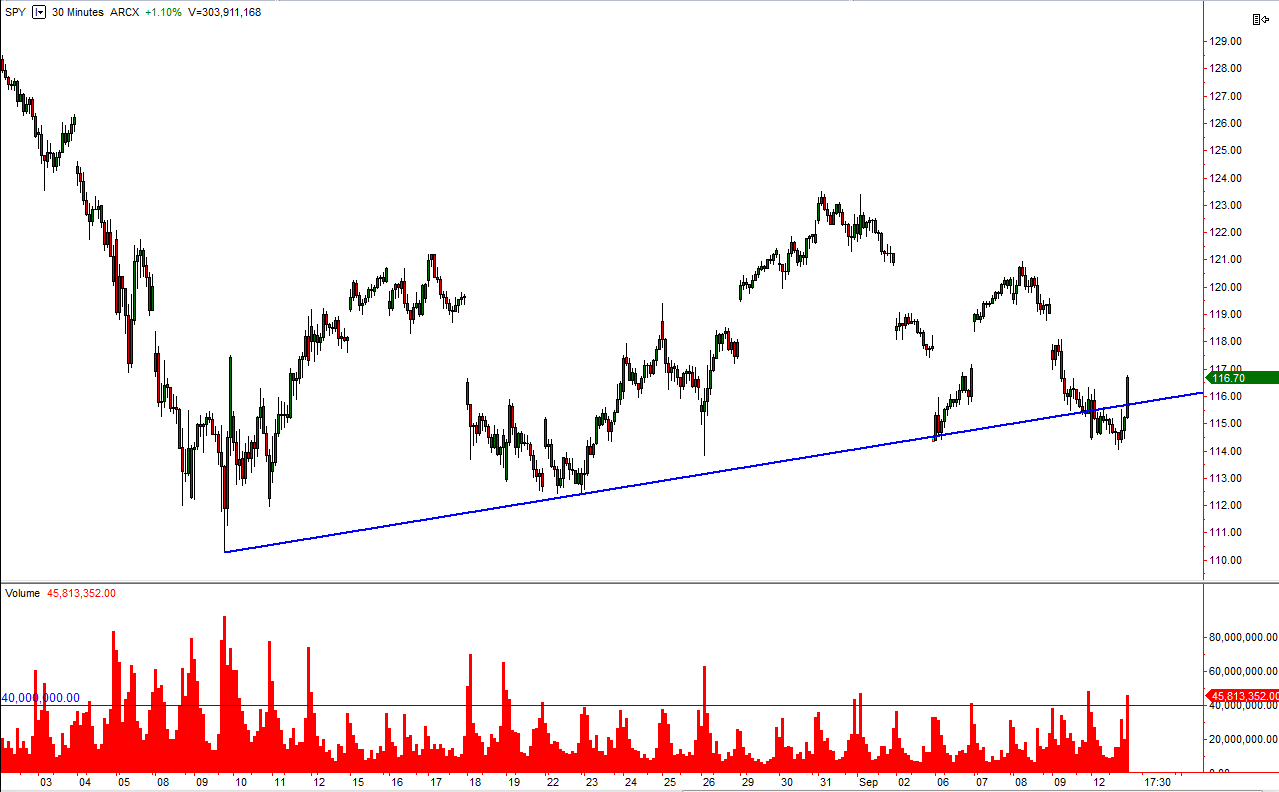
Another trend line held as a result of this bear trap late in the afternoon; a longer term trend line. It should be telling once we see the reaction from this initial move. Either buyers take the ball and run with it, or sellers fade it and force those buyers into sellers:
No comments:
Post a Comment