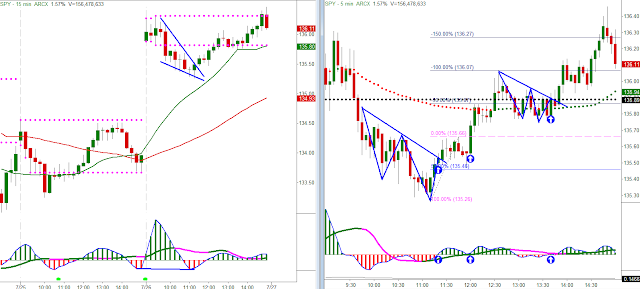
A key for the above chart to define the horizontal lines and dots. For further explanation, see this link:
Criteria 1b-1a throughout the day which means trades which anticipate a breakout and or base break.
The red diagonal line in the 15m chart above represents the cycle price and time projection I drew before the market opened this morning based on the symmetry of the cycles shown below:
The fuchsia line in the chart above reflects the cyclic trend line (a la Stevenson PTT) where a close through that line would indicate the beginning of the next regular cycle. A partial decline followed by a return to the $152.25 area would be pretty bullish.
The sketchiest thing at this point is the lower high scenario indicated on the 65m (also a reverse divergence currently) with the 15m showing a 2b criteria (Head & Shoulders pattern on the 15m 3/10macd).


