The setups I include on this blog are used in conjunction with the 3/10macd and the criteria I ascribe to it as a way to alert me to an existing condition of price. The key concept to take away from this blog is that I try to anticipate what will happen on the higher time frame by using a faster time frame to trigger the trade setup. I do not trade a "system" I use two indicators to clue me in to price conditions. Please read the Disclaimer located in the sidebar of this site. I can be contacted via email at toddstrade@gmail.com
I am always open to questions, comments, or suggestions on how to improve this blog.


Monday, January 28, 2013

Mon. 01_28

today's trade:
A key for the above chart to define the horizontal lines and dots.  For further explanation, see this link:  

Disappointed in not shorting the morning weakness

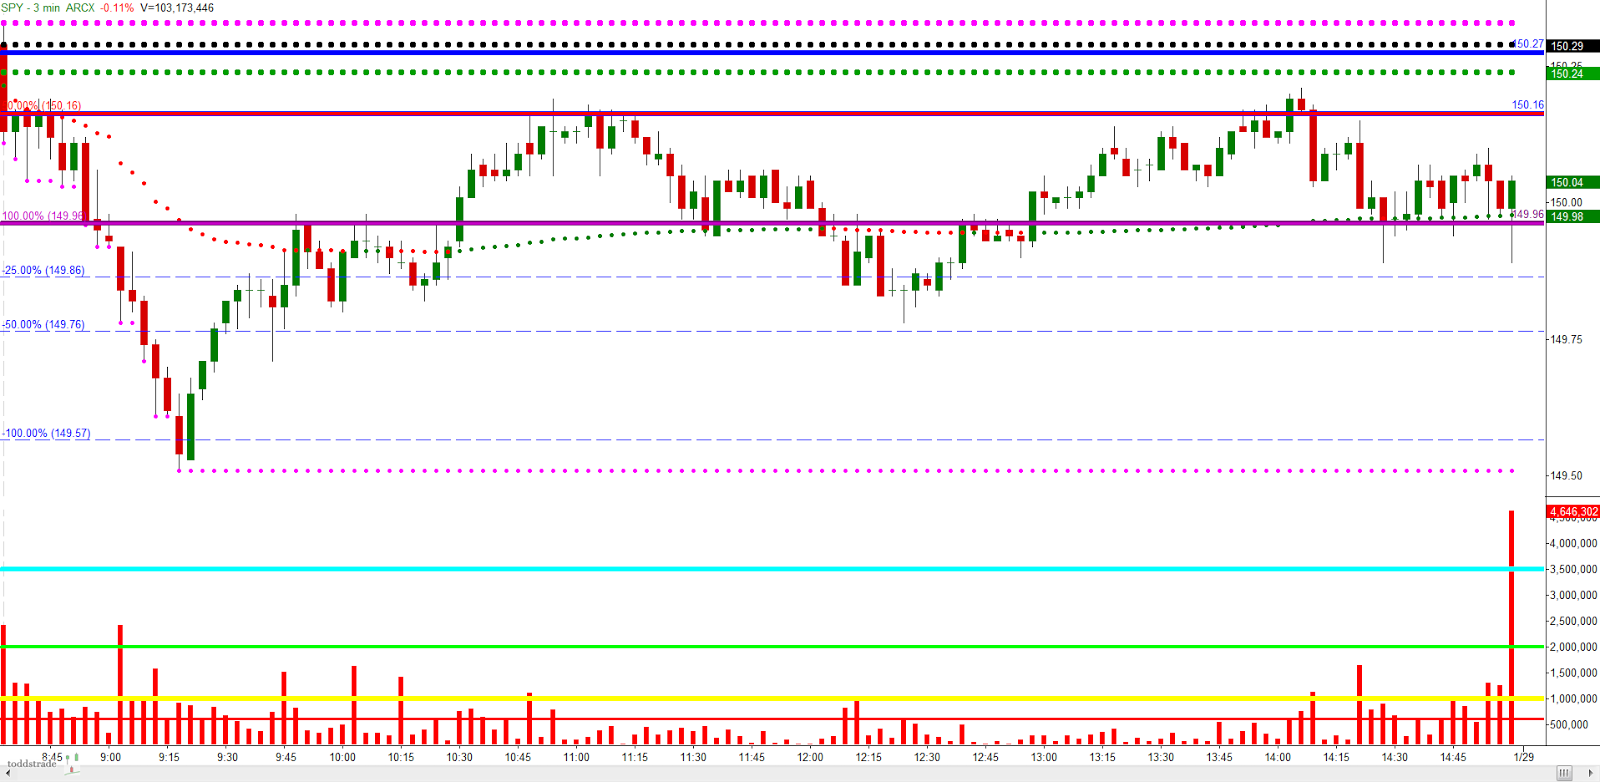
Higher time frame; breakout above $150.20 and below $149.50s

Price is now working sideways (accepted value area) and moving in relatively symmetrical cycles (coiling).  This should bring a momentum follow-through move in whichever direction it breaks

The longer this Head & Shoulders stays valid (invalid with a sustained move over $67.50-$68), the longer you have to wonder what a broad-based correction will look like

No comments: