There are often dual levels of resistance in these circumstances, coinciding with previous breakdown points. Interestingly, the previous 2 breakout to new high attempts were faded for larger corrections.
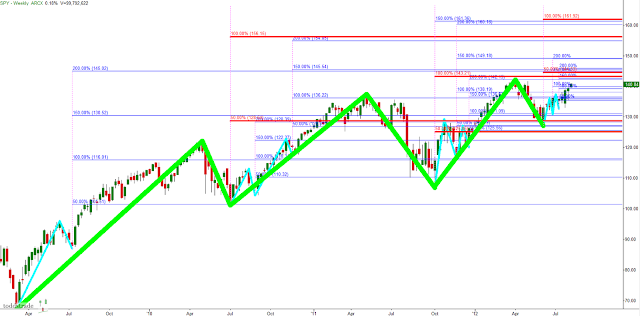
We also appear to be forming smaller seed waves which kick off these measured moves to higher highs. Below is a chart with Fibonacci projections based on the highlighted seed waves (7 of them):
The chart below adds in the 3 larger cycle moves (green) with red Fib. projections. The $143-$146 area has a good deal of Fib. confluence:
In the grand scheme of things, this monthly chart below we can see price has done a good job in filling in the previous momentum selling that began in June of '08. Price could stand to test lower for constructive price discovery, particularly given the importance of the overhead price levels which previously resulted in a double top. Trends end in a climax, and in my opinion we haven't seen one yet.
At any rate, the longer we take to test the $154.50 area, the better for sustained trend development. Keep an eye on the VIX going forward, which hasn't given any hints at a correction, though is holding a higher low (weekly) while the S&P holds this current lower high.


No comments:
Post a Comment