A key for the above chart to define the horizontal lines and dots. For further explanation, see this link:
The stage has been set for tomorrow's jobs report, and it looks as though it can go either way.
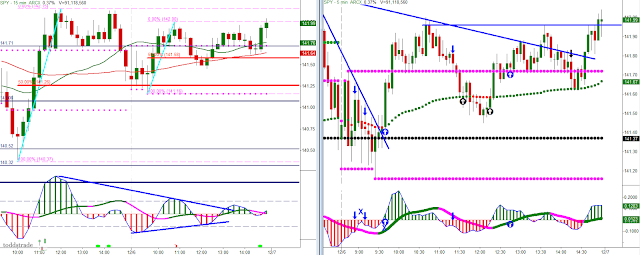
With the previously posted chart of the 3 bullish seed waves, dips have been supported. Disappointment would cause those dip buyers to sell and result in a strong selling day.
The bearish potential I can see comes in the form of this Head and Shoulders pattern on this chart:
With the previously posted chart of the 3 bullish seed waves, dips have been supported. Disappointment would cause those dip buyers to sell and result in a strong selling day.
The bearish potential I can see comes in the form of this Head and Shoulders pattern on this chart:
The higher time frame chart pairing (Daily/65min) I've been showing lately had what I would consider a long entry trigger about 2-hours before the close. This long "trigger" is an anticipation of the higher time frame (daily) fast line ticking back up (1a). I would consider myself stopped out of this setup should the 65 min fast line cross the slow line into negative territory, something we should know within the first hour tomorrow.
Bulls can make the case for this very large inverse Head and Shoulders, where a measured move would put us in the $150s (Santa Claus Rally cantalyst?)


1 comment:
Great charts :o)
Thank you :o)
Post a Comment