The setups I include on this blog are used in conjunction with the 3/10macd and the criteria I ascribe to it as a way to alert me to an existing condition of price. The key concept to take away from this blog is that I try to anticipate what will happen on the higher time frame by using a faster time frame to trigger the trade setup. I do not trade a "system" I use two indicators to clue me in to price conditions. Please read the Disclaimer located in the sidebar of this site. I can be contacted via email at toddstrade@gmail.com
I am always open to questions, comments, or suggestions on how to improve this blog.


Monday, January 30, 2012

Mon 1_30

3d setup in IBM this morning.  There are two Fib. projections made; one off the opening low/high, the second off of a smaller wave before price broke out (I inadvertently covered up the smaller flag with my up-arrow).
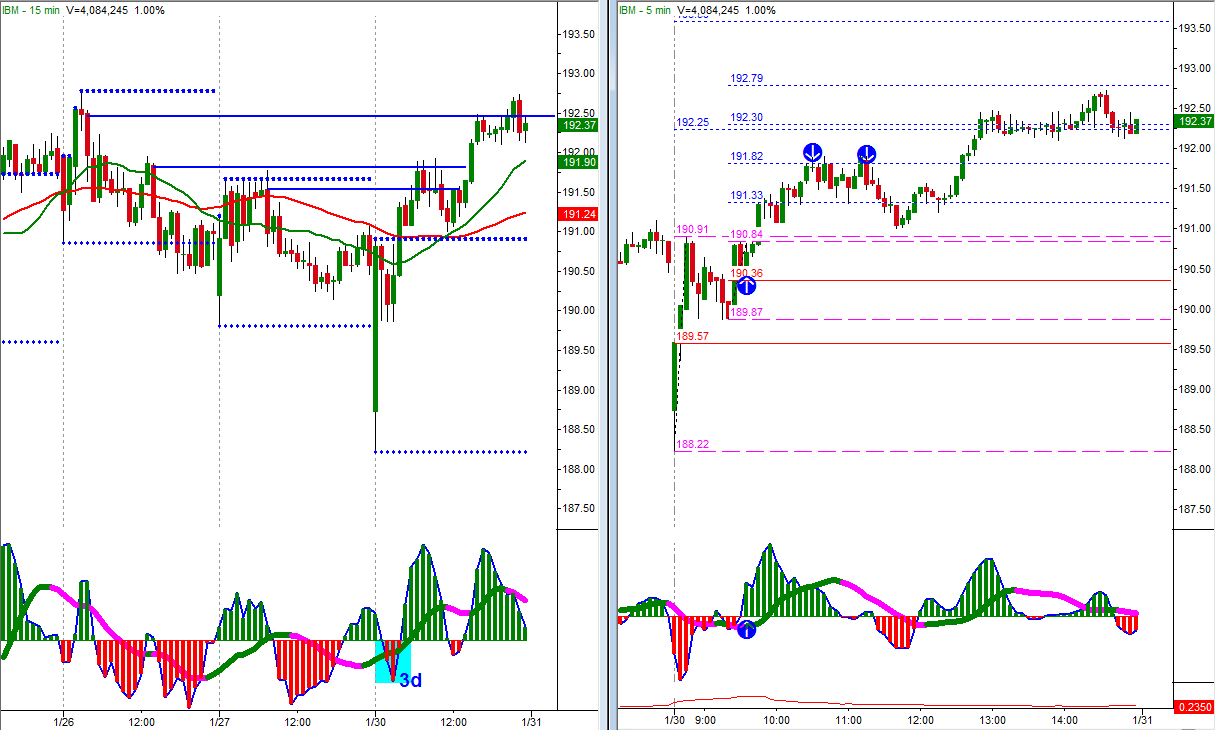
The 100% projection of the smaller flag was $191.82 which was an intermediate resistance level from 1/26.


SINA 2c-2d setup.  Notice the inverse H&S on the 5-minute chart.  Half taken off at the 50% projection and the other half taken off above $71 (I had an order to get out at $71.50 but when it missed it by a few cents I just closed out the position).

NFLX 2c-2d setup.  The two up-arrows on the 5-minute are not aligned.  The up-arrow on the indicator was the trigger, but the up-arrow under price was my entry.  The actual "trigger" candle was the one which comes after the up-arrow.   Half taken off at the 50% projection, the other half below the 50% projection.

No comments: