The setups I include on this blog are used in conjunction with the 3/10macd and the criteria I ascribe to it as a way to alert me to an existing condition of price. The key concept to take away from this blog is that I try to anticipate what will happen on the higher time frame by using a faster time frame to trigger the trade setup. I do not trade a "system" I use two indicators to clue me in to price conditions. Please read the Disclaimer located in the sidebar of this site. I can be contacted via email at toddstrade@gmail.com
I am always open to questions, comments, or suggestions on how to improve this blog.


Wednesday, August 8, 2012

SPY Channel

The SPY 130 minute chart (130 minutes because there are 3, 130-minute bars in one day; at least in a day that operates under regular trading hours).
The Red/Green vertical lines indicate when the fast line and slow line cross on the 3/10macd (green indicating a cross with a bullish bias, red indicating a cross with a bearish bias).  Interesting how they all correspond to a trend line break.

Thursday, August 2, 2012

wide range

A very wide overnight range due to the ECB puppet show.  With such a wide range I like to include a 25% Fib. projection to give a more reasonable initial target should the o/n low break.  Missed it by 3-cents in this case.
Nice pullback off the Open (vertical blue dash line) to the o/n_range midpoint.  There are two 3/10macd indicators on this chart, the top one just reflects the 15-minute time frame while the bottom one reflects the 5-minute.

Saturday, July 28, 2012

throwback

This looks to be (on the SPY) our 3rd throwback to a broken (steep) trend line (fourth if you count the 08/11 break to the  04/12 throwback).  Just the type of behavior that could get pretty climactic.


Thursday, July 26, 2012

thurs 7_26

SPY gap up day.
Price sold off showing a falling wedge on a reverse divergence.
Three potential entries.  I entered on the first up-arrow (5-min chart) for the 50- & 100% projection targets.  Later re-entered on the third up-arrow with a target of the day's high (corresponding with the lows of 7/20).


Wed. 7_25

Been a while since I've posted, I'll try to post more setups going forward.
 Previous day (7/24) was a 3d setup into the close.  Coming in to this day price tried hold previous resistance as support, eventually tested lower only to recover support.  The long setup was anticipation of a strengthening macd (1a criteria) following a reverse divergence.
The up-arrows indicate potential entry points (I took the 3rd one), while using the Fibonacci projections as exit targets.

Wednesday, July 11, 2012

bear flag

Bear flag setup in the SPY yesterday.  A particularly poor trade on my behalf, getting out WAY too soon and failing to get back in when I realized I got out way too soon.
In criteria jargon, this is a 2d-4c continuation setup.  Again, it's just a bear flag, I use the criteria as a way to subjectively identify it with the indicator.  It is just the fast line pulling into a down sloping slow line that is crossing (or has crossed) the zero line.
I partialled out for around 134.70 average, ugh

Friday, July 6, 2012

3d into the close

3d setup on the SPY.  I've mentioned before that the best time for them to set up is after the 2:00pm hour and into the 2:30 period.  The price characteristic going into them is either a Head & Shoulders or 3-pushes (first push here was the open gap down) to a low where the lower low results in a bear trap short squeeze.  Exits taken at vwap and the Open price. (horizontal black dots).

Monday, July 2, 2012

now what

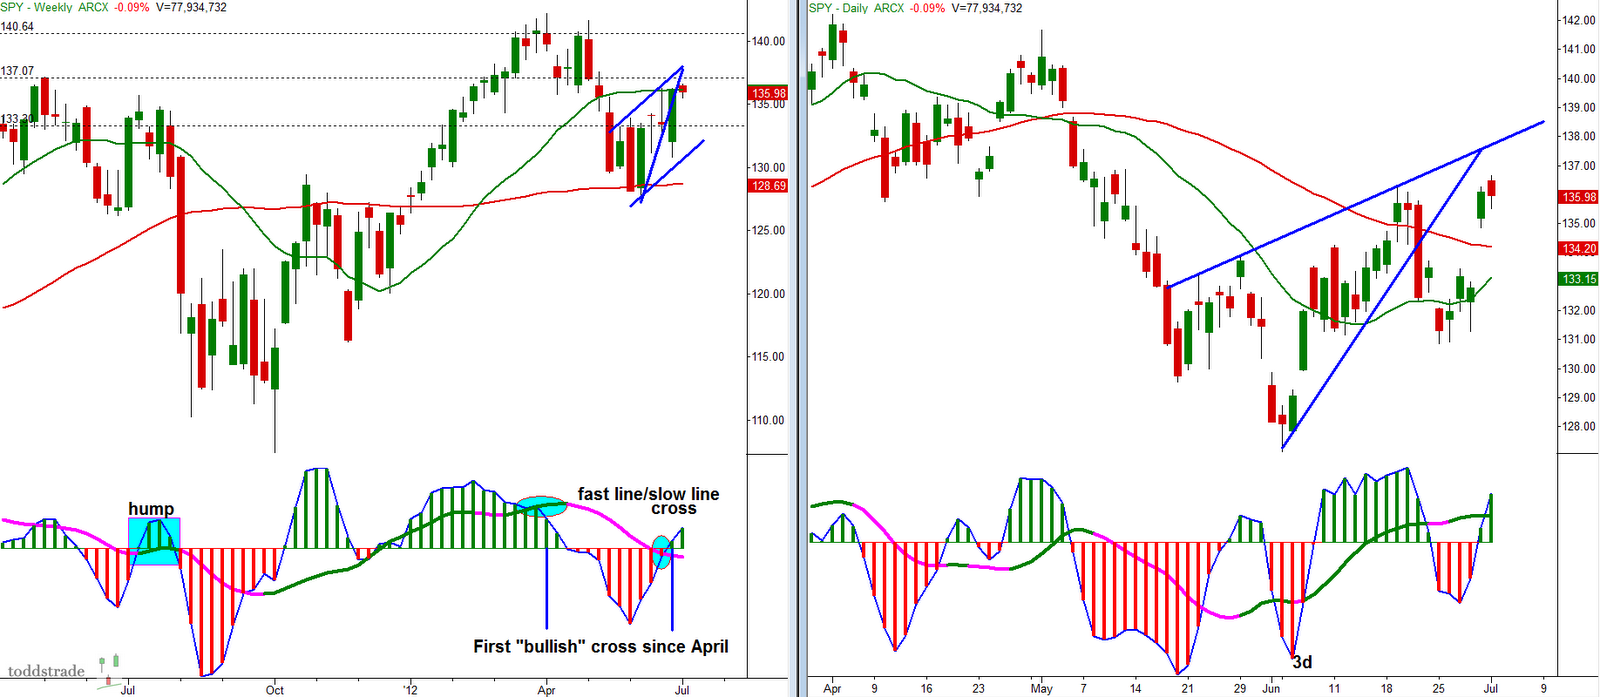
A quick look at the SPY weekly/daily charts after what has developed over the previous week.
The weekly chart shows the 3/10macd fast line crossing over the slow line (theoretically bullish).  This is the first bullish sign in three months.  Now, this can either be the beginning of a fresh bullish cycle or it can turn out to be a dud pullback that rolls over, like it did in July of last year (labeled "hump").
So far the daily is showing resilience and attempting to push through overhead resistance.  There exists the ideal progression, wherein we get a 3d setup (which in this case showed itself in the form of a bear squeeze) followed by a move higher (back into the Moving Averages window) to test overhead supply, then a pullback (2c-d) which is met with strong demand.  All-in-all looking buy-the-dip bullish.
If that weekly chart turns out to be a "hump" I would be looking for signs of weakness on the daily chart coming in the form of a failed support test (4c criteria).


Last week's range

The following is the SPY range for the week of June 25-29 including overnight activity.  Blue vertical dash line indicates the regular trading hours open while the fuchsia horizontal lines indicate the overnight high & low.
Monday - straight down out of the gate

Tuesday - attempted breakout of the o/n_high.  Failure pulled price out to the -50% projection before moving directly back to the o/n_high.  Breakout, retest, continuation out to the +100% projection.
Wednesday - tight overnight range (not giving up much from the previous day's close).  Breakout of the o/n_high, pullback test, continuation out to the +150% projection.

Thursday - opened coming into the o/n_low, chopping around it for most of the morning.   Seemed to trend down ever since the o/n_range's high print until the short squeeze.

Friday - trend continued in the o/n session.  After the open price spent a good period of time chopping around the o/n_high before extending higher.


Thursday, June 28, 2012

3d squeeze

3d setup on the SPY today.
I entered long on the second up arrow with a stop at new lows (10-cent loss).
Entered long the second up arrow.  Exits at 132.14 & 132.40 with 1/4 position held overnight.

Here's a look at the SPY including the o/n range.  A simple breakout of the overhead trend line/channel

Sunday, June 24, 2012

weekly signal

The SPY weekly may be setting up a 4d-4c sell continuation setup.  Price is inside the "window" (between the 20- & 50-MA's) and we have the 3/10macd slow line crossing zero (which often precedes a 20- & 50-MA crossover) and the fast line pulling into it (essentially a bear flag).  Price is at a critical juncture.  A move higher (thereby turning the fast line positive) would force a squeeze.  While a tick down in the fast line could initiate a bear flag sell-off (this would also trigger a first cross sell signal).


  A clue to what may develop on this weekly macd setup will be how the daily behaves.  A negative tick down in the fast line would be a potential sell signal (though I would prefer the fast line to set up an X-Y-Z pattern that looks like this


So, should we sell lower we could possibly anticipate buyers to step in around the $130 mark and maybe we get boost higher from there, at which time that fast line on the macd would set up the zig-zag pattern I mentioned above.


Friday, June 22, 2012

SPY week

Weekly overnight and regular trading hour ranges.
Monday:  Stayed within the overnight range


Tuesday:  Breakout of the overnight highs just after the open, extending out to the 100% projection
 
Wednesday:  FOMC day.  Overnight highs were contained, while the lows broke and extended to the 100% projection lower, finishing right at the o/n session's midpoint.

Thursday:  Big trend day down.  Notice how long price oscillated around the o/n_lows before breaking.

Friday:  For the most point held the midpoint before extending higher to the 50% projection.


Thursday, June 21, 2012

Copper drip

As part of the great commodity unwind of 2012 Copper continues to drip lower.
The daily showing potential to continue its move lower towards the 100% price projection around $3.18

The weekly highlights the quite large Head & Shoulders pattern where a move to the neckline seems imminent.


Crude Crash

OK it's not crashing, but it's off 25% from 7-weeks ago and threatening a test of the 2011 lows.  The one technical possibility is the potential for a 3-pushes to a low pattern here as momentum wanes. The 3-push pattern can include a vicious sell-off followed by an equally vicious short-covering rally.

These weekly Fib. projections beneath the 2011 lows look towards the $71 mark and there is a confluence at the $57 level, but it can't go that low, can it?

Saturday, June 16, 2012

this week in SPY

This week's trading in the SPY with pre-market activity.  Vertical blue dash line is the regular trading hour open, fuchsia horizontal lines are the overnight highs/lows.
Monday - Trend day from the beginning.  Notice how the first 5-minute bar cut right through the o/n_lows and didn't look back, making it difficult to enter if looking to short a pullback. 

Tuesday - A false breakdown of the o/n_lows leading to a squeeze in the other direction.  Support at the o/n_highs eventually holding and extending into the 150% projection.

Wednesday - Price holding the o/n_lows, attempting to break the o/n_highs and eventually selling off down to the 50% projection.

Thursday - A narrower o/n range with an early breakout to an eventual tag of the 100% projection.  Late afternoon pullback coming very close to the o/n_high and extending higher on extreme volatility.

Friday - o/n_lows hold and move higher throughout the day.

week ending 6_15

After spending all week inside of a range (besides the sold-off outlier which started the week) price began to work its way higher, closing the week almost to the penny where it started out.
In the chart below; For the most part all dips were bought (highlighted 2c-2d conditions).  There were 3 larger sell-off moves (one last week) which were all contained within range and the latter two giving a regular and a reverse divergence.

So, we have managed to creep ever higher into the resistance zone we were looking at going into last week. There doesn't seem to be a case for overall weakness these past two weeks (aside from the prevailing overhead supply).  Price hasn't pulled back much at all since the island reversal, and a strong follow-through day above the 50-day  MA may likely cause big money to chase (as we've seen that play out time and time again).  The 20- & 50-MA's on the weekly still have a bullish orientation to them after holding that 38.2% retrace.  However, maybe not seeing much of a pullback is reason to believe in possible exhaustion at the 50-day MA.

The QQQ held major support at the $60 level.  I've blogged frequently about the 2c-2d setup, and typically the entry to that setup is the 3d criteria on a faster time frame, which is what we see on the daily chart below.  Provided it can get through the resistance point formed on Monday ($63.38) our first target objective would be the 50% Fib. projection at $65.

Now for the ugly duckling.  The IWM certainly the weakest looking of the bunch, particularly with that higher time frame structural lower high looming overhead.  The daily still has room to move higher before getting tied up in the 50-day MA and overhead trend line.

The DIA is leading the charge here and may be our "tell" going forward.  There is nothing bearish about the higher time frame at this point.  A strong V-bottom followed by higher highs & lows.  It has yet to form a lower high yet (though one can argue the case of a double top), so what happens from here is critical for both bull & bear camp.   Either we break out to new highs or fail to (isn't that always the case?), in which case we get a lower high and a steeper slide may likely unfold.
Next week should be very telling.  Either price is rejected off of the 50-day Moving Average that it just happened to close right underneath of on Friday, or we get a gap and chase rally?  The reverse divergence in place here is a bit concerning though (if bullish) as it often portends a "too far too fast" corrective or consolidating move.
I drew the Fib. projections on the daily chart with the 6/08 day as my high (rather than the 06/11 high) as that had the lowest low and, therefore, the steepest correction to date.  This means the 50% projection target is just within reach.


Tuesday, June 12, 2012

This has all happened before...

...it will all happen again.
Just worth noticing the similarities which occur after sizable distribution phases.  In my opinion we're in the Gap Trap phase at this point.  Bullish or bearish is less relevant at this point.  For a sustained move in either direction it will take time before institutions collect their inventory based on where they see the market going.   If this is a consolidation before lower lows it should take time before that happens.  If this is consolidation before new highs, it should take time before that happens.  In the meantime, we should cycle within a range.


Monday, June 11, 2012

AAPL setup

The AAPL setup mentioned last week looks like it has potential to roll-over.  Clearly rejected in the resistance zone and at the 50-day MA.

resistance resists

Price made a go of it, gaping above resistance but was aggressively faded.  With the SPY (below) there still remains the opportunity of putting in a higher low with some likely support around $130 initially.

And, for all intents and purposes, putting in a higher low is much more constructive in terms of price discovery.  The Moving Averages say bearish, so rips are getting faded until the tide changes.  Speaking of which, here's a look at the SPY with just the 20- & 50-day Moving Averages (the "tide").  While bulls can consider a lower high from here on out to be constructive, the bears can consider higher price discovery to be desirable.  If price moves higher, say to the 50-day MA, that would give the Moving Averages a chance to form a similar wave pattern as the ones highlighted below.  Either way it will take some time, maybe things will be clearer by month end.


The U.S.Dollar index had a strong day, still waiting on a follow-through day though

Treasuries a similar story as the dollar above

While Crude Oil remains to be getting crushed (here represented by USO).  Approaching lows not seen since last October (of which, last October they weren't seen since '09).  At least with these pesky speculators getting crushed (even though there are two sides to every trade) gas prices will be plummeting any day now, right? hmmm
This USO has to be due for a dead-cat bounce soon I would think, no?

spy o/n

Meant to post over the weekend the SPY weekly trading ranges; premarket and regular trading hours.  Blue vertical dash line is the market open, fuchsia horizontal line is the overnight high/low.
Monday:

Tuesday:

Wednesday:

Thursday:

Friday: