
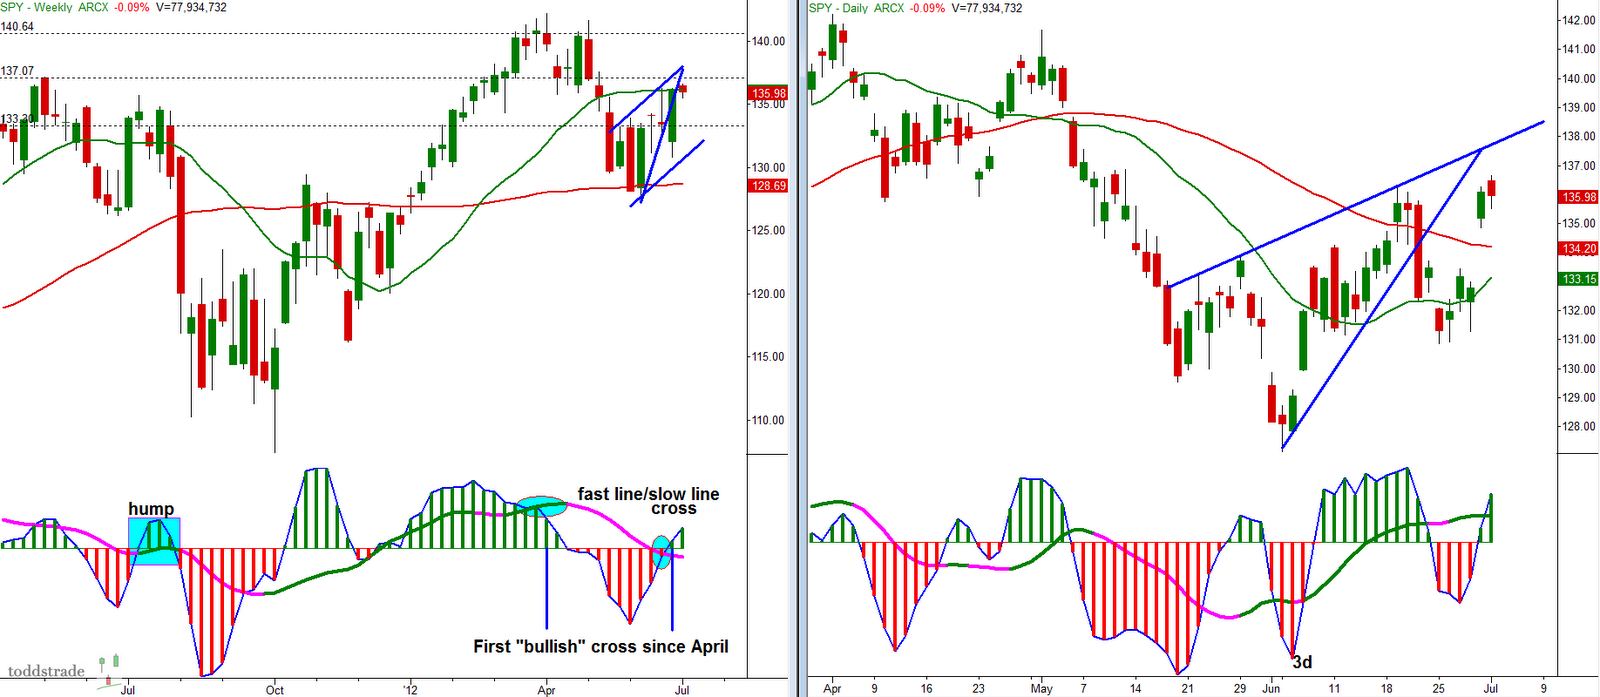
The weekly chart shows the 3/10macd fast line crossing over the slow line (theoretically bullish). This is the first bullish sign in three months. Now, this can either be the beginning of a fresh bullish cycle or it can turn out to be a dud pullback that rolls over, like it did in July of last year (labeled "hump").
So far the daily is showing resilience and attempting to push through overhead resistance. There exists the ideal progression, wherein we get a 3d setup (which in this case showed itself in the form of a bear squeeze) followed by a move higher (back into the Moving Averages window) to test overhead supply, then a pullback (2c-d) which is met with strong demand. All-in-all looking buy-the-dip bullish.
If that weekly chart turns out to be a "hump" I would be looking for signs of weakness on the daily chart coming in the form of a failed support test (4c criteria).
No comments:
Post a Comment