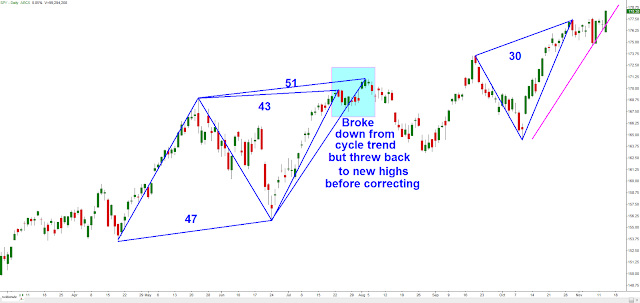
Very symmetrical cycle count leading up to this breakout. It is easily possible that this current inverted cycle could last another 18-days and it would be symmetrical with the preceding 22-day regular cycle.
There is a caveat:
The second and third cycles in the image above (marked 51 and 47 respectively) have a price behavior pattern that is similar to a 'throwback' to a trend line. Being that the Cyclic Trend Line (CTL) is so steep, price naturally "breaks down" from it out of the sheer speed of the move. But because the prevailing move was so strong this is seen as a buyable pullback (channel on a faster time frame perhaps) and so it makes a new high while throwing back to the CTL which, in turn, warrants a re-drawing of the CTL and giving us a new boundary for the beginning of our next cycle.
These next two charts illustrate what I'm trying to convey.
So, that 'caveat' being that there is potential for the same thing to be taking place currently, as is shown in the chart below:


No comments:
Post a Comment