SPY with TICK & volume. Significant volume at the lows of the morning (on a + TICK div) as well as on the low TICK of the day at the IB_high. Notice the 1:30-2:30 negative TICK div (perhaps a sign of a small squeeze, forcing shorts to cover)
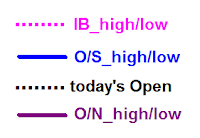
A key for the above chart to define the horizontal lines and dots. For further explanation, see this link:
Advance/Decline issues trended up all day with price while the Up/Down_volume trended down, but rounded and turned after 1:00pm.
SPY 15m & 5min with 3/10macd below. First up arrow long entry was taken at the prior bar because of the inherent strength. Blue arrows are entries, black arrows are exits.
The setups I include on this blog are used in conjunction with the 3/10macd and the criteria I ascribe to it as a way to alert me to an existing condition of price. The key concept to take away from this blog is that I try to anticipate what will happen on the higher time frame by using a faster time frame to trigger the trade setup. I do not trade a "system" I use two indicators to clue me in to price conditions. Please read the Disclaimer located in the sidebar of this site. I can be contacted via email at toddstrade@gmail.com
I am always open to questions, comments, or suggestions on how to improve this blog.


No comments:
Post a Comment