The setups I include on this blog are used in conjunction with the 3/10macd and the criteria I ascribe to it as a way to alert me to an existing condition of price. The key concept to take away from this blog is that I try to anticipate what will happen on the higher time frame by using a faster time frame to trigger the trade setup. I do not trade a "system" I use two indicators to clue me in to price conditions. Please read the Disclaimer located in the sidebar of this site. I can be contacted via email at toddstrade@gmail.com
I am always open to questions, comments, or suggestions on how to improve this blog.


Monday, January 10, 2011

Monday hindsight

The low-volume drift continues
In the early morning, price on the SPY double-bottomed at the previous day's low on a momentum divergence (a regular divergence intraday and a reverse divergence compared to the PDL).
Initial resistance was met at the 50% fibonacci retracement as measured from the PDC to today's Open

Nothing too significant regarding the NYSE TICK.  A small divergence at the lows and you can make the argument for a reverse divergence later in the day.

Sunday, January 9, 2011

FCX

The first week of 2011 saw profit-taking in FCX, resulting in a Dark Cloud Cover candle pattern, looking for confirmation in the week ahead.

Should weakness persist through the month of January we would also be looking at a Dark Cloud Cover candle pattern on the monthly chart, corresponding with a double top (horizontal line indicates the 50% mark where I would suspect some support).

Price has been initially supported at the 20-period MA on the Daily chart, which also happens to be showing a small bear flag, but the 50-period MA could be solid support which would equate to a 61.8% retracement of the December monthly candle and a solid price support level

Thursday, January 6, 2011

Catching Up

After spending way too much time in New Jersey for the holiday's I'm now back and left having to reconfigure workspaces and watchlists lately after losing most of it to a recent system upgrade.  But it feels good getting back into the swing of things.
The markets are regaining some vigor now that we're starting a new year.  Compared to the micro-range drift we were experiencing for most of December. Yesterday stopped a lot of shorts out, while today faked a lot of longs out.  You  have to shake out the rug before deciding where it will go:
Yesterday being a bullish bar, long's were eager to trade a breakout, resulting in a mild sell-off early on when that breakout failed.  Price found support around the 50% retracement measured off of the previous day's High to Low:

A few TICK divergences:

Friday, December 17, 2010

Weekly Bars

Interesting close to the week.  Only two weeks left in the year, think they can hold it up for that long or are we due for a correction?  Things certainly look to be getting heavy on the upside.

All weekly charts are showing bearish candle patterns.

The SPY showing a key reversal bar (though it is lacking in range); Higher Open, higher high, closing down and below the previous candle's close:

DIA - printed a shooting star

QQQQ - Hanging man with a high 33-cents shy of the '07 highs

SMH - hanging man type candle with a lower low, lower high, higher open with a lower close than the previous close.  The real body actually engulfs the previous candle's real body:

IYT - Transports putting in a key reversal bar, with a real body which engulfs that of the previous bar:

Meanwhile, the VIX tested a low not seen since April '10.  A good time to fade the move into support?

Thursday, December 16, 2010

TICK

Looking at the SPY ETF combined with the NYSE TICK and noticing some interesting divergences these past few days

First the Daily

Over these last 8-days we have had two positive divergences (lower low in price which registered a higher low in TICK). These divergences were combined with a hidden divergence where price formed a higher high on a lower TICK reading


While this morning, what appeared to be a sell-off ended up being a bear trap with higher TICK readings on lower price:

Tuesday, December 14, 2010

rounded top?

Who out there considers this to be a rounded top in the SPY?  Remember, a rounded top can break out in either direction!  Vote now!!
If I don't get more than 10-votes I'm closing this blog and nuking the contents....tick, tock, tick, tock...

GOOG

Interesting development in GOOG lately.  Price has closed under the daily Open for the past 7-days straight, all while closing higher than the previous day!?   Seemingly drifting along the midline of this pitchfork.


Over the past two months GOOG has retraced as much as the 61.8% mark, and sits above it's 50%.  There's a lot of clear air above and below price right now.

Should price explore lower from here after recently failing this steep trend line, the first stop-trigger level may be around the $585 mark.  I'm looking towards that $578 mark:

LOL Fed Day

The SPY closed above the previous day's close. 


Which has been the case for the past 6-days.

It's almost as if the market needs to close this way for a specific reason. 
The end of day hammer candle, was it mostly short-covering or buying??

Monday, December 13, 2010

waning breadth

A few observations throughout today's session.
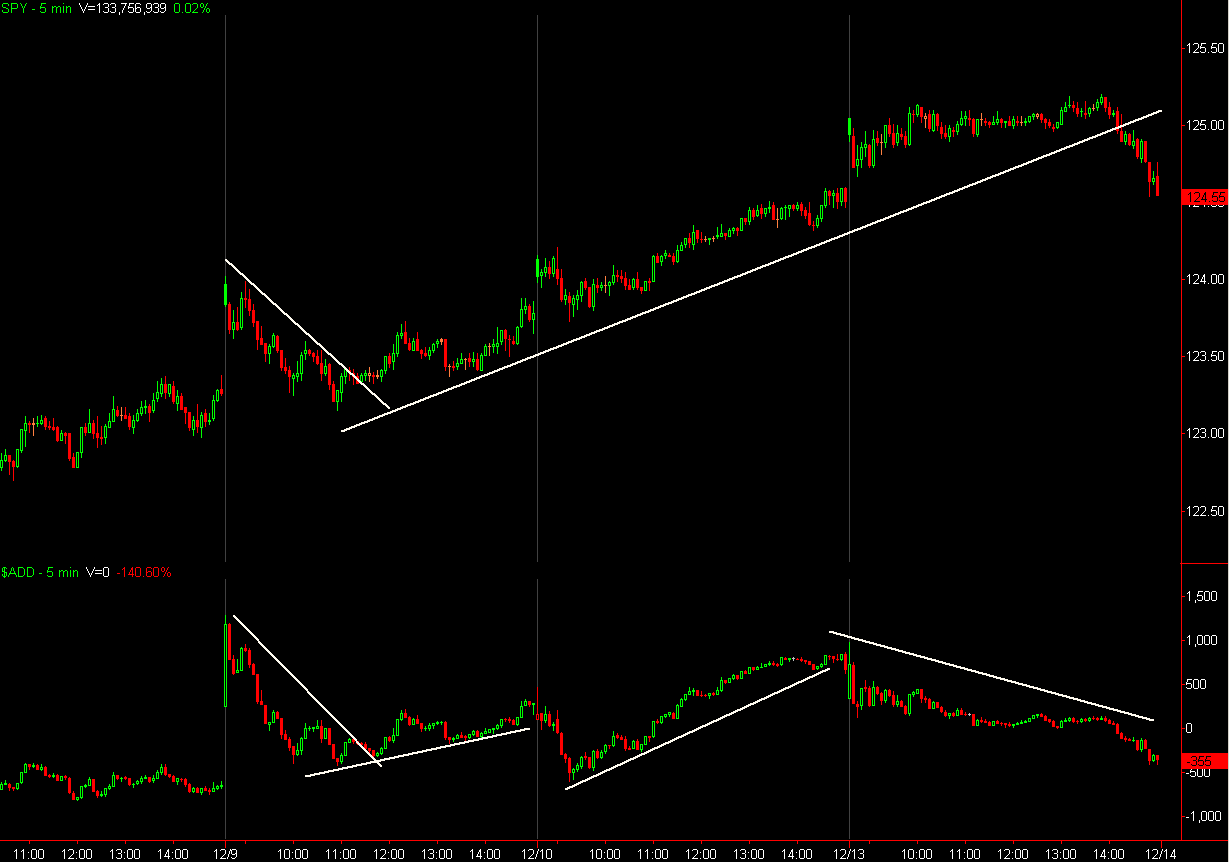
Negative TICKs far outweighed positive TICKS considering we were at over 2-year highs.  Also of note is the fact that we gaped up yet again on a weak positive TICK.


The advancing vs. declining issues were trending down all day long

While the Up-Down Volume did get bullish, but again diverged from the previous two days

Saturday, December 11, 2010

TICK this week

Was dusting off an indicator that I stopped using for some unknown reason and was just looking over the past few week's performance in pairing it with the SPY.  The indicator (found hear) brilliantly cleans up an otherwise noisy, and distracting, NYSE TICK. 
Over the course of the past month what do we see?  Surprise, surprise!  Participation on the sell side with seemingly very little extreme upside TICKS.
 Perhaps all the juice needed came on the 29th of November (extreme +TICK in ellipse).

It's all very simple in hindsight.  The most recent lows (Nov. 16th)  were made on an extreme TICK followed by a divergence.  Since that point the lows (in price or the TICK) didn't go any lower.

The following are just a series of charts with some TICK/Price divergences.  It's likely I may have missed some, but I'm putting these up simply because they are helpful to study.


The charts which follow overlap in date from the ones above, but I wanted to show some in a little closer detail.  Also, I added a Fib. retracement based off of the first half of the day's High-to-Low range.  When it comes time to positioning oneself for the close of a market, it could be as simple as realizing whether you're trading in the top or bottom 50% of the day's range.

There's a glaring "hidden" divergence in the chart below that is not illustrated, telling you that though TICK has made an overly dramatic lower low, price made a higher low, leading to a buying opportunity.


Healthcare sector lit up

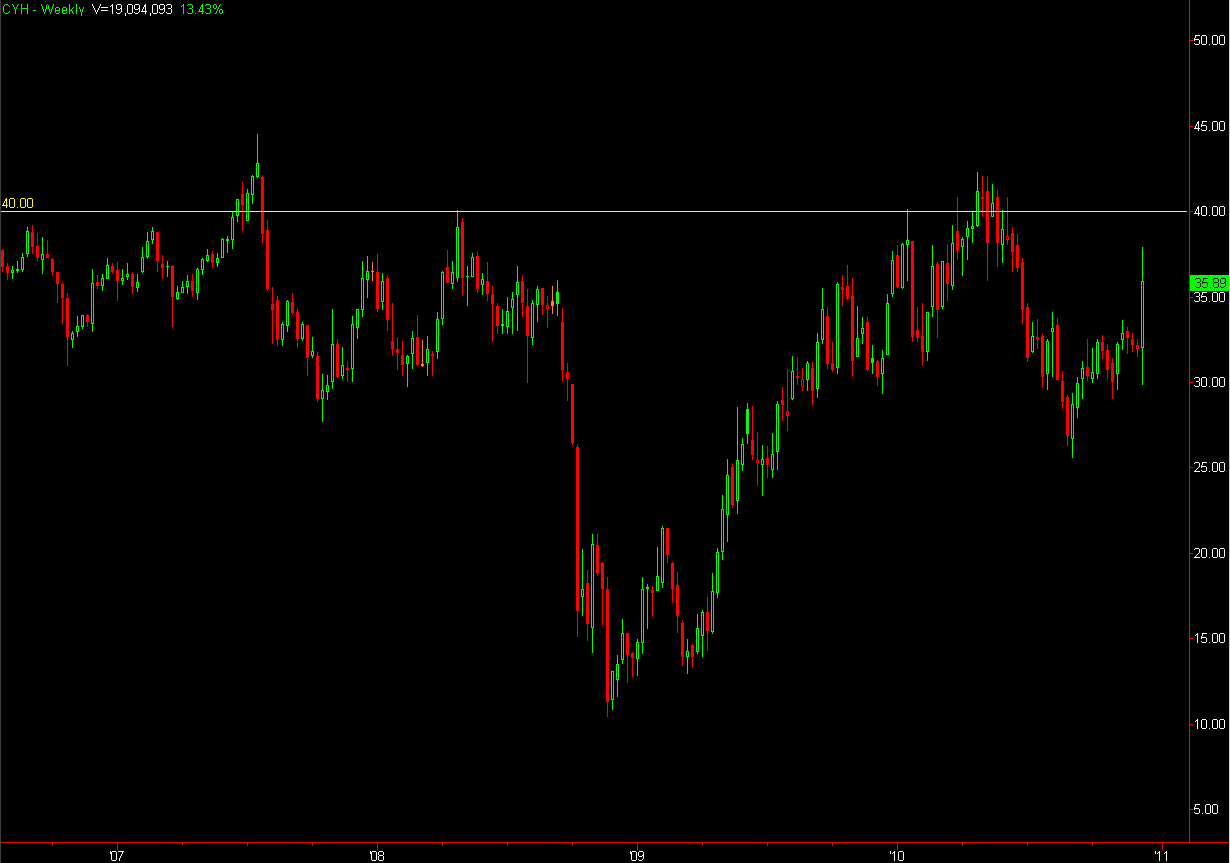
CYH's bid for THC brought some attention to the XLV this past week.
Currently XLV is down 1.5% for 2010 (the most lagging of the 10 most tracked sectors, followed by Utilities, XLU and Financials, XLF).

weekly charts showing all sorts of inverted H&S patterns with an overhead neckline:
XLV -Could have a breakout move in the week ahead

CYH, of course that big move all happened in one day though-


THC again, a one-move wonder on Friday-


While other components of the XLY show some promise.
A lot of clear air above for UNH


MRK - broke out from this W-bottom pattern and looks to try to regain $36.50 support

AMGN - formed a hook (seed wave) with what looks like a breakout candle on Friday

PFE is interesting.  This weekly chart shows a large amount of volume over these past two years.  While price recently broke out of and re-tested this LONG-standing down trend line

Friday, December 10, 2010

Utilities lag

The Dow is still under it's previous swing highs (perhaps the one thing preventing this market from really taking off)

Transports have been chugging along, closing just under the selling wick of Tuesday

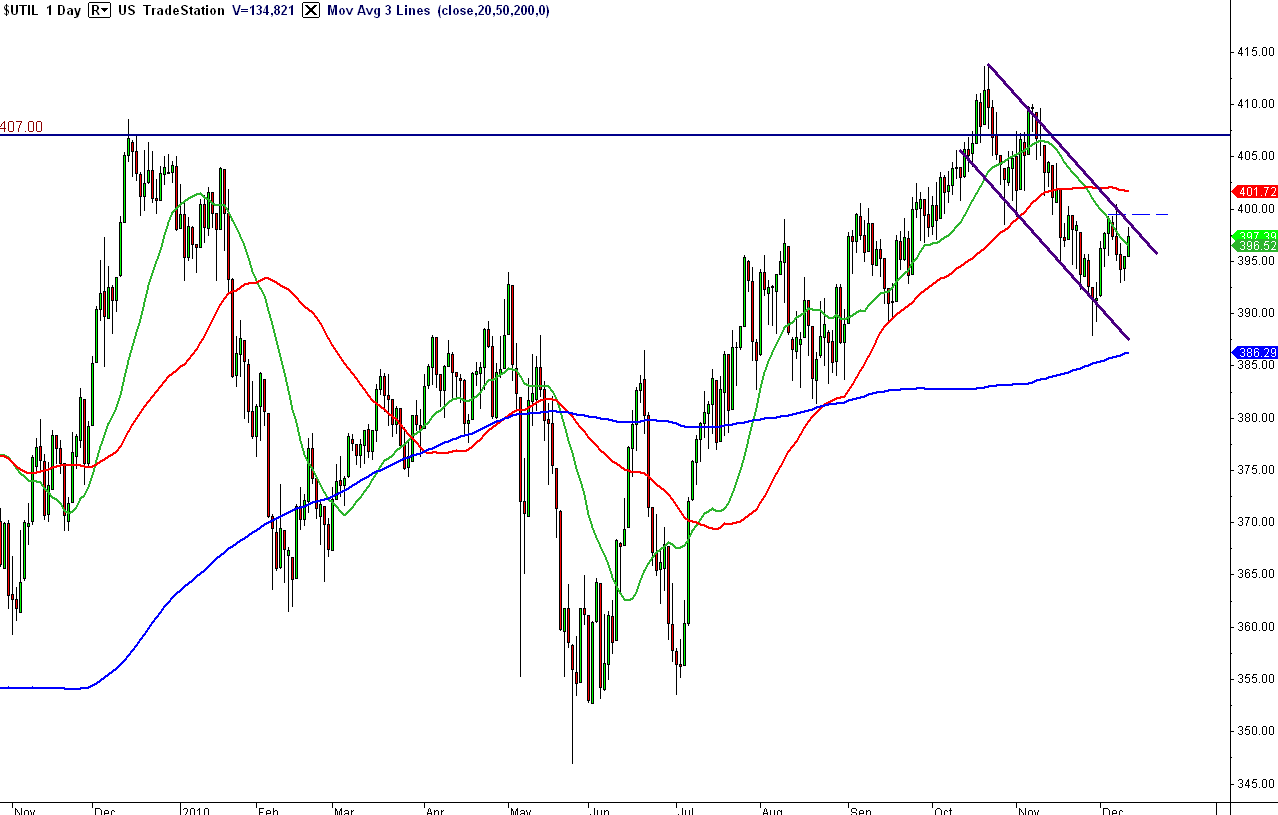
The Utilities however,  are in the process of pulling back from a test of previous swing highs:


There's something within Dow Theory regarding the agreement of these three components (Industrials, Transports, Utilities), so it's curious to see how it will all play out.
The laggard (Utilities) is within the top portion of a down-sloping channel, where it looks to be at a potential breakout point

Price has made a little hook (seed wave) these past few days, which could trigger a long entry, but how much resistance the overhead 50-day MA puts up will be very telling as to whether these 3 components begin to gel.

Thursday, December 9, 2010

setting up for something

SPY intraday has formed an inverted roof pattern


 Patterns within patterns.  These intraday inverted H&S patterns never achieved their measured moves.

Whichever direction it breaks out, the measured move comes out to about 1-1.5%

some pitchforks

GOOG....resistance at the midline

NFLX - most recent momentum impulse, didn't quite tag the midline


XLF - squeezed back inside and looks to be wearing out on this second test of a gap

AMZN - broke it's midline this morning

SPY - just can't seem to make it back to the sliding parallel line, try as it might

DIA - never tagged it's midline.  Is this a double top waiting to be resolved, or a pause before popping back up to the lower median line?  The key reversal day was telling everyone to take profits, but downside has been delayed so far.