The setups I include on this blog are used in conjunction with the 3/10macd and the criteria I ascribe to it as a way to alert me to an existing condition of price. The key concept to take away from this blog is that I try to anticipate what will happen on the higher time frame by using a faster time frame to trigger the trade setup. I do not trade a "system" I use two indicators to clue me in to price conditions. Please read the Disclaimer located in the sidebar of this site. I can be contacted via email at toddstrade@gmail.com
I am always open to questions, comments, or suggestions on how to improve this blog.


Wednesday, February 29, 2012

i think it's called a sell-off

It feels like we haven't seen this in a while.  A proper bearish day.
Worth noting is the A/D-line pullback to zero on a lower TICK which preceded the selling into the end of day.  Curious that we didn't get a lower TICK reading on those lower lows.

So, one sell-off does not a top make and the previous swing low is still intact, for now.  A curious development on the higher time frame ES we have lower momentum on our higher swing highs with lower momentum on our higher swing lows.  Tomorrow should be interesting; a correction is welcomed by both bears and bulls alike, but going forward a lower high is the first step in developing a bearish bias.

So, provided the SPY lows are taken out going forward, we do have some targets to look to given that today's momentum-pullback-continuation formed a very symmetrical seed wave

Tuesday, February 28, 2012

Tues. 2_28

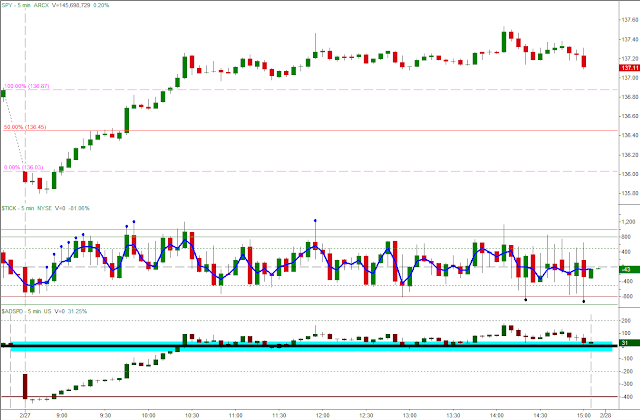
An example of a short trade followed by a long trade in the SPY today.
2b-2c short setup entered on the down arrow and exited at each Fib. extension for a total of 4 exits.

This then led to the 2c-2d long setup.  The trend held and the higher low was on lower momentum (reverse divergence).  Again, there was one long entry, followed by 4 exits at each Fib. target.

Worth noticing was how the "sell-off" corresponded to a failure of the A/D-line's zero-line on a low TICK of the day (dash vertical line just past the 12:30 hour).  Price (and the A/D-line) then stabilized on higher TICK lows.


Monday, February 27, 2012

Mon. 2_27

The ES continues it's drift.  Notice the confluence of Fib. projections at the 1390-1394 area.

The gap down just gets bought up.  Once the A/D-line got back to zero price just vacillated at the highs for the rest of the day.

Crude saw some selling late in the day, but the trend being so strong buyers are likely hunting for buy-able entries

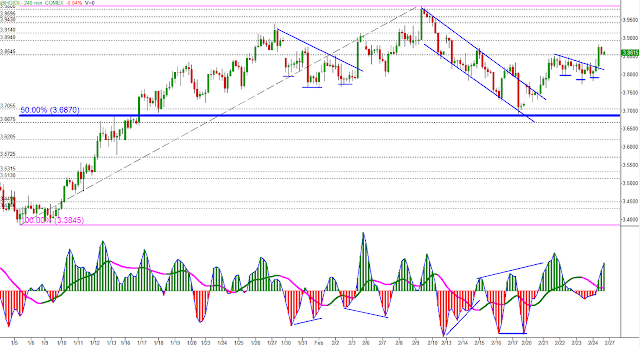
Copper still not able to recover that overhead resistance

Sunday, February 26, 2012

Euro

Euro/USD pair currently pulling back within a down trend.  The steep Fib. retracement of 78.6% has been a typical move of these pullbacks going back to June of last year.

So, a move to the 1.38's wouldn't be unrealistic.  This would fall in line with the higher time-frame's upper trend line

Of noticeable importance is the January lows in the 1.26's.  If these lows remain intact this gives the pair a structural higher low and potential inverted Head & Shoulders on the higher (monthly) time frame.

Saturday, February 25, 2012

Constructive Copper

It has been a seemingly rough weeks for Copper, but under the surface it has been very constructive.
Price was still unable to recover that trendline (neckline) which it broke down from last week, but perhaps next week we'll see some resolution to that.  Price managed to close above the daily 20-period Moving Average on Friday's close.

The weekly time frame finished with a strong inside bar, constructively consolidating under the September 2011 breakdown point and regaining that $3.76 mark which has shown to be a prior resistance/support level.

Looking a bit closer we can see that the recent selling almost made it to the 50% retracement of our previous breakout momentum, an encouraging sign for bullish potential.

  Looking for at least a test of the $3.99's over the next week or so.

Thursday, February 23, 2012

same ol trend

Starting with the higher time frame and drilling down.  The SPY trend is still very much intact.  Notice the lack of negative readings for both the fast line and slow line on the 3/10macd.  On a shorter time frame (I use 130-minutes because there are 3-bars for each daily bar) we had yet another 2c-2d setup:

As mentioned before, the 2c-2d setup should include most, if not all, of the following:
 - A strong bullish trend
 - A reverse divergence
 - 3-pushes to a low and/or
 - Inverted Head & Shoulders
 - and possibly a 3d setup on the faster time frame

So, here are two faster time frames (sorry for the confusion, but the faster time frame is on the left in the chart below)

and the 15-minute chart; notice the 100% projection lined up with the fib. fan's mid-line which was finally achieved into the close

Another similar setup occurred in AAPL today.  The trend was in place, we got 3-pushes to a low followed bu an inverted head and shoulders pattern and the 50% projection lined up with the fib. fan's mid-line


And here's one to watch going forward in BIDU.
Provided the trend line remains intact, we'd like to see the second fib. fan line taken out on a strong candle.  The brunt force of resistance looks to be initially at the $135 level.  If the setup fails there can be an equal opportunity on the short side if the trend line breaks down.


Wednesday, February 22, 2012

Wed. 2...something

Haven't been inspired to post anything lately.  So I guess I'll just post some charts.
An update of Copper.  Seems to be having trouble regaining that neckline, which corresponds with the 20-day MA


OIH weekly is coming up to an important resistance level.  A pullback and basing under $45.28 would be healthy, but you never know how exuberant things will get.

Crude recently achieved two targets; the 100% projection and 20% Fib. fan


The ES is mildly pulling back so far from the previous 2/16 momentum

and while it seems long in the tooth, the trend remains intact for now

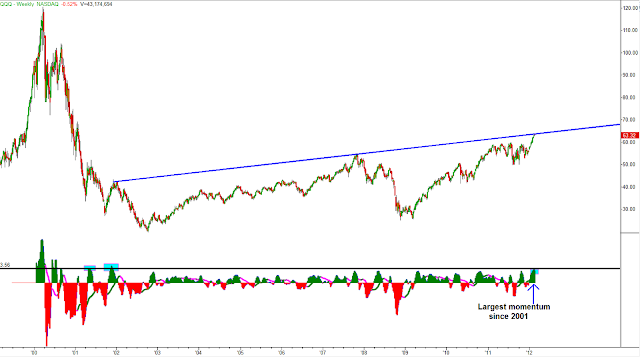
Finally, the QQQ;  The weekly has registered the highest momentum since 2001, and while large momentum readings can signal higher prices to come they can also signal impending pullbacks

This trend has not touched the 20-day MA all year and has an overly extreme slope

Friday, February 17, 2012

copper clopper

More selling in Copper, next stop looking like the 50-day MA

With the daily 50MA below there's also the 50% retracement mark from the previous upward momentum

Then I got to looking at a larger perspective.  This weekly Head & Shoulders pattern would take some time to develop, but it still stands out

Thursday, February 16, 2012

copper

Have been watching copper regularly now, and what I thought was going to be a 3d on the 240-min chart ended up pushing lower this morning only to end in a buy divergence/bear trap anyway.  The 60-min chart actually set up the 3d criteria and price rallied all day long, eventually tagging its 200% projection.

The daily had a 2b breakdown and is now setting up a 2d long entry where you would be looking to buy the next pullback in the 240-min chart.  Essentially, in the 240-min chart above (furthest left) you would be targeting the blue dash line just above 3.9 initially, but if the trend is strong it should take this level out and tag the next upward sloping blue line just north of 3.95

thurs. 2/16

Just a few chart examples of setups and/or things I look for.
Coming into the open this morning the SPY was setting up the 3d criteria.  As mentioned before, it pays to check a chart with pre-market data for anything which may pop out.  The black dash line represents the Open while the up-arrows are potential long entries (one of which wasn't so good, but the rest more than made up for it).
After the open price briefly tested the previous day's lows and look how the Advance/Decline line bounced off of zero and we trended higher for the rest of the day.  Also worth taking note of, the low TICK of the day occurring at 3:15 was the perfect entry for a move into the close (it usually is on trending days).
Take a look at the longer term trend in the ES.  The overnight and previous day's momentum was the lowest since December 28th and yet we put in a higher low compared with February 10th (Slingshot setup)

I have posted this chart before and I'm doing so again because I find it to be uncanny how the past is repeating itself in this market
Here is the SPY in 2010

and now

Tuesday, February 14, 2012

tue. 2_14

Two examples of the 3d setup today.
First, NFLX - impatience led to an early exit

The setup in the SPY into the close today was tricky.  The first entry would have been a stop-out while the second entry was triggered late and right up against one of your targets (50% projection).

The squeeze wasn't THAT much of a surprise (well, perhaps the range of it was surprising, but the anticipation of a sell-off was less favorable) while watching TICK (divergence) at the 2/10 gap fill ($134.38).

Monday, February 13, 2012

Mon. 2_13

BIDU triangle breakout.  Two Fib.s drawn, 1 from the previous day's close to today's open, the other from the low of day to the following swing high.  Shaken out of half position as price struggled with the highs of the day.

SINA - took the morning scalp trade, 2-min chart entry

missed the ascending triangle break later in the day.

Here was a failed trade in BTU.  Based on the 3d setup, there were three potential entries (I took the first up-arrow, not the other two) where two of them were stop-outs, the third finally worked).

Copper 2b

Copper looks as though it may be forming up the 2b short setup.  Watching for a potential breakdown of the "neckline".  Plenty of support underneath.

Saturday, February 11, 2012

just a chart

My latest obsession being Copper.  I found this weekly chart interesting.  Some observations:
- Strong downward momentum followed by consolidation wedges seem indicative of bottoming.
- Momentum breakouts from these wedges seem to begin a new strong trend.
- Most recent downside momentum came with a higher price low.
- Most recent upward momentum was strongest since June of 2010 (goes along with a triangle breakout).
- Once a trend is established the trendlines have been very clean, while a breakdown from the trendline sees an equally clean throwback to the trendline before a steeper correction ensues.
- The momentum breakout of the wedges is proportionate to the pullback which follows.  So, for instance, the first one back in 2009 saw 5-weeks up upward momentum followed by 5-weeks of consolidation pullback.  The second breakout in 2010 saw 3-weeks of a momentum breakout followed by 3-weeks of consolidation.

At this point we could suspect that a pullback from here has buyers interested.  Should price fail from this breakout and return to the 3.45 area we could presume that longs might be trapped, causing a dramatic failed breakout selloff.   But at this point things are looking good for Dr. Copper.


Friday, February 10, 2012

fri. 2_10

First off, coming into this morning we had some divergences showing up with evidence of buying at the lows in the pre-market.  The selling at the 9:00am hour led to lower lows but also set up the 3d criteria.  Often times I look for an inverse Head & Shoulders pattern with the 3d, but a lower low is just as valid because in that situation you have 3-pushes to a low that results in a short covering move.  Here's a look at the charts which include pre-market data:

The triggers in the above 3d setup (two sets of up-arrows) weren't stellar but strops weren't triggered, best entries were at the 50% retrace.  Also, the 50% projection was achieved but the 100% percent target was capped off by the pre-market supply zone (dash line of the Fib. fan on the 15-min chart).
Here's an updated chart of the one above to include the after hours market, where price finally reached the Fib. fan extension based off of the pre-market


Now some setups.

Two examples of the 2c-2d long setup; One bad, one good, see if you could tell what characteristic exists that makes one a better setup over the other:

 First, BIDU.  I missed the first trigger (first up arrow) but entered at the 50% projection with a target of the 100% projection for a quick 80-cents.  I included the second trigger (second up-arrow) to show the extent which discretion plays in these setups.  Just because it can be perceived as a trigger doesn't mean I'll take it, especially if price is extended, most of the targets were reached, and/or of it's an overall bearish day.

Second, NFLX.  I was quickly stopped out of this trade, however, had I used the correct stop placement I would have remained in the trade (I typically use an ATR on the 5-min chart to give me stop placement, the ATR at the time of entry was 65-cents and I put in a 50-cent stop which was triggered.  Irregardless, I would have likely taken a loss either way).


So, you can probably tell that the main difference between the two 2c-2d setups is the strength (or lack) of trend.  It's always preferable to find setups which have a prevailing trend.

Here was another 2c-2d setup in V.  Using a 30-minute chart.  I missed the first triggered entry but took the second.  Also left a decent amount on the table by taking profits at the 50% & 100% projections.

Finally, a late afternoon trade in BIDU again.  Exits again at 50% & near the 100% projections.  I was actually holding out for the $137.40 price (dash line of the Fib. Fan) but the high was at 137.37.