The setups I include on this blog are used in conjunction with the 3/10macd and the criteria I ascribe to it as a way to alert me to an existing condition of price. The key concept to take away from this blog is that I try to anticipate what will happen on the higher time frame by using a faster time frame to trigger the trade setup. I do not trade a "system" I use two indicators to clue me in to price conditions. Please read the Disclaimer located in the sidebar of this site. I can be contacted via email at toddstrade@gmail.com
I am always open to questions, comments, or suggestions on how to improve this blog.


Thursday, July 21, 2011

continuation move

A continuation move, and on strong volume!  I thought price only went DOWN on volume in this market?  There is still a layer of resistance overhead, so we could still get a failure to break through, but this is a step in the right (bullish) direction.  A 50% projection target on this seed wave comes out to the $140 level.
This short squeeze game has been playing out for the past two years non-stop.  Today was yet another example of price gaping up and triggering short positions to be covered.  It would be critical for price not to close too bearish tomorrow (also through next week) as then there would still be hope (for bearish positions) for a double top type formation, around the $135.50 area or even the $137 level.

However....where the SPY and DIA have more of a bullish tone, the IWM & QQQ are lagging (non-confirmation?) and have more room for bearish supply coming into the market.
DIA - still room for a double-top

IWM - still plenty of room for error.  I can see it being a better setup if it came down slightly to put in a right shoulder to an inverted H&S
QQQ- plenty of room for a double top or failed breakout overhead
also, all four of these index ETF's are still within a Head & Shoulders formation on the weekly time frame (charts to those were posted yesterday).

Wednesday, July 20, 2011

just charts

Looking at the weekly SPY;  A head & shoulders pattern stands out (mirror image pattern as that of the bottoming pattern from the flash crash recovery (April through September of 2010).  It appears that the market bulls are at a critical juncture if prices cant begin to follow through from the momentum candle 3-weeks ago.
While the daily chart shows we had a strong selling binge from May through most of June wherein we corrected over 75% of that move on a strong squeeze which ended in an evening star pattern.  The 3/10macd may be setting up a 2a/2b criteria which often results in a good shorting opportunity.  I think a strong close at/above $134 may invigorate another bullish advance, but also feel that the overhead gap zone will see heavy supply come in.


This is what I'm looking at in terms of S/R

Meanwhile, the QQQ is interesting;  The weekly also looking like a topping pattern. The most recent move up registered a reverse divergence (higher momentum reading on a lower high) which would trigger on a tick down in the histogram.
The daily nearly printed a dark cloud cover pattern ("nearly" in that technically it is supposed to close at least 50% of the previous green bar, but fell shy of that). Also setting up that 2a-to-2b short setup. 

Here's an example of that 2a-to-2b short setup on the IWM weekly.  The idea is that the 3/10macd slow line is trending down as the fast line corrects into it, and it is triggered by a tick down in the histogram (indicated with blue arrows.  There was one instance that turned out to be a less than stellar trigger, but the others worked quite well (on a return to support-test basis).  However, the slow line now seems to be at a crossroads; it can turn up with added upside momentum, or it can lose its positive slope and continue negative.
The daily chart of the IWM is hinting at more immediate upside and if that's the case the strength of the upside test will have to prove itself on a closing basis, otherwise it looks to possibly trigger a 2a-to-2b short signal.

One other intriguing chart is that of the SMH.
The weekly is triggering (should the week close with the histogram ticking down as it currently is, but that IF remains) a 4c-to-4d short entry.  While the daily is waiting on the very same setup to trigger.  The chart had a few reverse divergences to work off, but what gives a bearish lean to this chart is how quickly the large green weekly bar 3-weeks ago was quickly wiped out.  A tell would be to see how successful price is in testing the overhead gap left from July 12th.

Tuesday, July 19, 2011

Monday, July 18, 2011

Posted this chart a few times last week as it updated.  We broke down from our up-trend line and are in a throw-back process that coincides with a down trend line.  TICK is diverging positively so far.
Price has reached the measured move from the H & S pattern mentioned last week and filled the gap left from 6/28 coinciding with a 61.8% retracement

Had a bunch of support levels close together at these 1290 levels on the ES, corresponding to the 61.8% Fib. retrace

The ES came just shy of a 150% projection off of its seed wave setup and continues to test lower

same setups

Three trades, all of the same ilk. 
Counter-trend bottoming formations.
Seed wave patterns with a 50% correction forming the higher low.  Targets being the 50% & 100% projections.
SPY

GS - If you notice, the inverted hammer candlestick IS a seed wave unto itself.
FCX

Friday, July 15, 2011

updates

Updated charts from previous posts this week regarding the ES and SPY.
Lows coincided with a throwback to a down trend line where we worked into a sideways base on more muted TICK readings:

Updated 60-min ES chart with prior S/R levels.

seed wave

Two seed wave setups in the SPY today:
The first fell within a few cents of its 100% projection while the second was strong into the close.

The second seed wave later in the day I was anticipating because of a 3d setup on the 30-min chart. double bottom on solid support that closed above a resistance level that was tested all day long:

Thursday, July 14, 2011

where we're at

Another extreme negative TICK while taking out the previous day lows (but NOT BY MUCH).  The ship isn't quite sinking on these extreme TICKS. 
Two throwbacks to the down sloping trend line that we broke out of on Wednesday.  We could certainly be in a bounce-able level here.  Basically a 50% retracement at a decent support  level.  

Would certainly look to buy for a bounce if we see $129.84 price as it coincides with the original up-sloping trendline and the projected measured move out of the H & S pattern that recently set up.  I would have to think anything lower, down to $129.50 should draw in strong buying interest.

A 3d long entry was setting up on the close today.  Curious to see what comes of it, however, it wasn't quite ready on the faster time frame.  Also, there's a higher low (nearly double-bottom) seed wave going into the close, so there's that.

tick

Posted on Chart.ly last night.  Extreme negative TICK fade coming into today (lower TICK on higher lows):

Bounce got faded quickly...

Wednesday, July 13, 2011

update

Updated chart off of last nights post.  Didn't reach the 100% extension of the seed wave.  But S/R was decent.

3d setups this morning

A lot of 3d setups into the close yesterday, so they were on the watchlist for this morning.
 CLF -  two sets of Fibs to base targets on; from the previous days seed wave to this morning's gap range

MON - again, two sets of Fibs to base targets off of, the ideal entry was at the break of the first 15-min candle's high

QCOM - lost patience with this one and got out as it started coming back to the base

Wish I would have taken POT instead of the QCOM

Tuesday, July 12, 2011

so simple...

...in hindsight.
The @ES 60-min chart bounced just above a 61.8% retracement.  Of course the bounce occurred in the Euro session. 
Since Monday's Open the intra-day trend has been down.
Coming into this morning's session the 3/10macd was in a 3d setup multi-swing divergence.
Seed wave located within the shaded area.

A look in closer

and a closer look on the faster time frame

Monday, July 11, 2011

long bonds

TLT - A three-layered approach to keep things in perspective;  the long-term (Moving Averages) was aligned strongly bullish, the intermediate (15-min 3/10 macd) was strongly bullish, and the short-term time frame triggered a buy when the fast line turned positive.

FCX set up a (counter-"trend") buying opportunity on a momentum buy divergence which on the 5-min time frame was a 3d setup.  The Fib. projections were based on the 1-min chart where the seed wave was easier to identify.  Only held for the move to the Open. 

Friday, July 8, 2011

just stupid

In ONE SECOND
SPY - one second $0.92 range on 246,123 volume

ES - one second range of 8.5 points on 6,638 volume

Thursday, July 7, 2011

higher time frame

I use two time frames to trade.  One time frame which I make trading decisions off of based on anticipated setups and a faster time frame used to time entries (all covered in the document in the sidebar 3/10MACD Trading).  So, I thought I would take a look at how you may have used the weekly & daily charts to trade a longer term positions these past few months.
Coming into our recent sell-off in the SPY we had a previous swing low being tested, leading to a higher low on a lower momentum reading (reverse divergence).  This condition wasn't technically triggered until after the weekly bar's close when it was all but too late, which is why I use a faster time frame to act on the anticipation of such events (though I'll have you know I failed to anticipate this setup).
So, while the weekly chart was showing strong downside momentum all the while the previous swing low was still intact, our daily chart was showing a multi-swing divergence of its own at these lows (lower price lows on higher momentum lows). 

Take a closer look at the daily chart and what price and momentum were telling us.
 All very easy in hindsight, but a very mechanical approach is what allows one to ignore news/message boards, etc.
 
Now take a look at some previous swing type setups that occurred over these past few months.  Using the weekly chart to alert you to a criteria and the daily chart to time an entry.
 
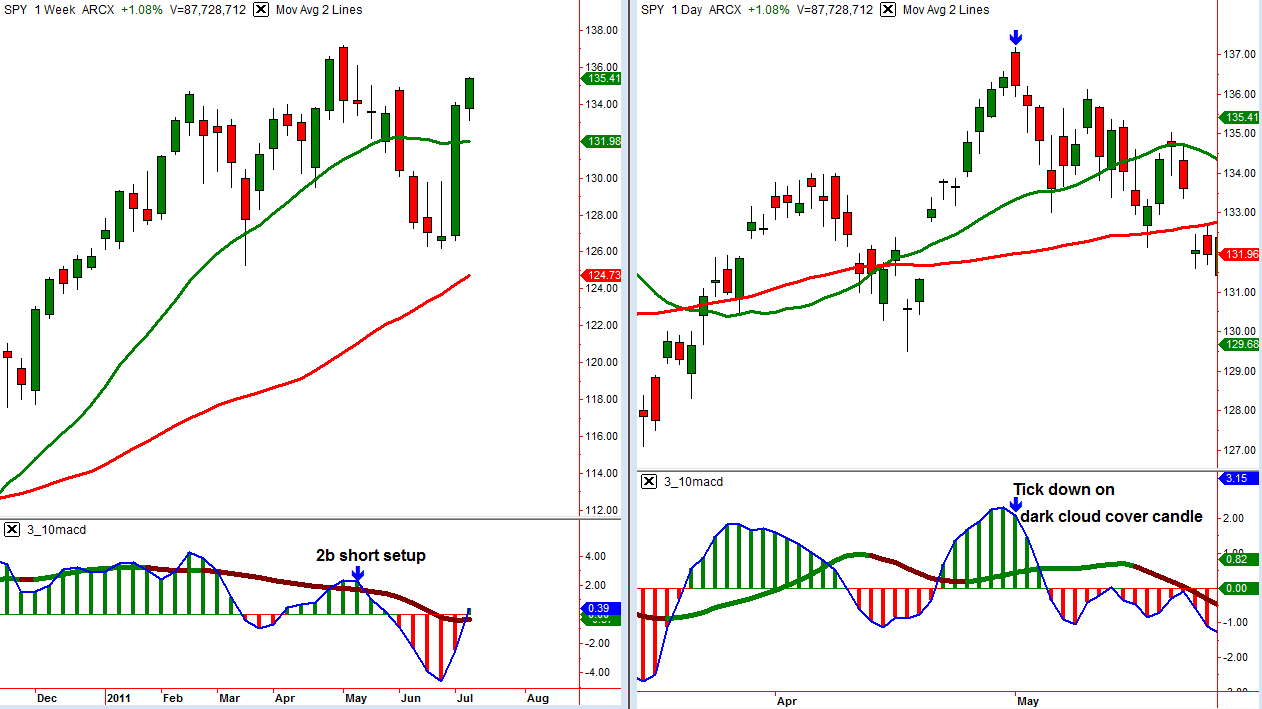
2b short setup (what's a "2b setup"?) on the weekly (left), timed entry on the daily (right) chart

and my favorite, 3d setup on the weekly going back to March '09 and the timed entry on the daily

Wednesday, July 6, 2011

last two days

Just some charts of the past two sessions in SPY.
Worth noting; the lack of negative TICK (blue histogram), the time of day when the "bottom" was made (9:50-10:10am CST).  Also, the Fib. projections off of the bottoming seed wave (100% projection reached) and the support/resistance levels based off of breakout points (where price broke out became support, where price broke down became resistance).
Tuesday:
Wednesday:

 Higher Time Frame:

 Daily; the overhead gap resistance on a reverse divergence looks to me like it will be worth a try at shorting:

Just an observation; When the 3/10 macd is in its 1a phase and the Moving Averages are oriented bearish with such a wide space between them as is the case in the above daily chart, one can look for a short opportunity at resistance.
{Update} I should have amended the above statement by saying; Unless we gap above resistance, which has been such a common theme these past few years.  This morning's gap up was just ridiculous! :/

I'll Buy That

Green hammer on the 15-min chart, I'll buy it any day


5-min breaks down as such; entry off the break of the 15-min hammer bar's high, exit as resistance.  Second entry based on inverted H&S, exit at 100% projection of the initial wave

Tuesday, July 5, 2011

not much

Inside day following a trend day, not much going on.

Decent long entry after the 10am low off support (3d setup on the faster time frame) exits were premature.

Other than that, there was a 3d setup in ANR for 30-cents.