The setups I include on this blog are used in conjunction with the 3/10macd and the criteria I ascribe to it as a way to alert me to an existing condition of price. The key concept to take away from this blog is that I try to anticipate what will happen on the higher time frame by using a faster time frame to trigger the trade setup. I do not trade a "system" I use two indicators to clue me in to price conditions. Please read the Disclaimer located in the sidebar of this site. I can be contacted via email at toddstrade@gmail.com
I am always open to questions, comments, or suggestions on how to improve this blog.


Wednesday, December 2, 2009

Spike & Ledge

SPY formed a "Spike & Ledge" pattern this morning on a test of new 52-week highs.
The pattern was coined in Linda Raschke's book Street Smarts, below are links to other articles relating to this climax pattern. Price set up perfectly on top of the PDH before flagging and selling off.
http://www.scribd.com/doc/2532983/Break-Out-Strategy (page 12)
http://www.trading-naked.com/library/raschke-linda%20raschke%20-%20keeps%20up%20the%20pace.pdf (page 5)
http://www.lbrgroup.com/index.asp?page=DailyCharts&date=2005-12-29

Tuesday, December 1, 2009

AIG range

Looking at AIG we see price approaching a potential support level ($25) after an epic fail:
and ABC "correction"
and in the most recent year, price bounced and put in a mid-summer higher low:
And more recently, looks to be in it's 3rd push down:in these past two days price broke down from the $33 level and today retraced steeply (nearly 78.6% since the close last Friday):
by the close today, price looked to have put in a bear flag. Watching $29 support level and possibly a breakdown from there (Support, becomes Resistance, becomes Support, becomes Resistance!):

RIMM setup

Taking a look at RIMM from this morning we can see a lot of similarities in price structure, like those I mentioned in yesterday's post with POT.
First we start with the opening range gap up that was above 50% of the previous day's range.
Price rallied for 20min of the open, forming an ascending wedge. The correction off of this pattern was quick, but found volume support at the Fibonacci 78.6% retracement level (measured from the low of the day to the high of the ascending wedge).
Chop ensued, but the 61.8% retracement level held with volume (this 61.8% retracement is measured from the opening low to high) and coincided with the 38.2% retracement measured off of the previous day's range.
So, we had:
- a gap up followed by 3 higher highs and 2 higher lows before a correction
- the retracement barely tested the 78.6% level and strongly held on to the 61.8% with volume
- the pattern that price created for the first 90-min was a bullish wolfe wave/triangle breakout
- the opening highs acted as support later in the day (RbS)
So, if you're long at this point, where can we look for potential targets/resistance?
-First suspect would be highs of the morning and if we could break out of those highs next would be the previous day's high (in the $59.50 level).
-Next, we could draw some 3-point Fibonacci extension lines drawn off of impulse moves.
The first extension can be drawn from the LOD to Opening range high and measured off of the beginning of the move up.
Once we had another impulse move and correction we could draw another extension line so we can look for possible confluence levels/targets. Here's what we got:
So, lessons learned:
-Watch how price gaps compared to the previous day's range
- Watch the 61.8% & 78.6% levels (if it's a deep correction) to hold on volume for a higher low and possible test of the highs or previous day pivot levels
- Fibonacci extensions drawn off of impulse moves can give clues to possible consolidation levels.

update

Regarding the bullish Wolfe Wave I mentioned over the weekend (in POT), today the target was reached. Now what?

Monday, November 30, 2009

A closer look...

....into POT's opening price behavior. A lot can be learned by observing areas where price pivots to make a higher high or lower high.
This morning price gaped up (higher low) above the previous swing high (higher high), and above the previous day's range.
- Draw a Fibonacci Retracement from the previous day's close to the open. Can price hold above the 50% level? Volume on a price reversal tells you it can...back to test highs.
Price puts in a higher high, but retraces sharply.- Draw a Fib. Rtr from the most recent swing low to high. Can price hold above the 78.6% retracement? Price reversal and volume tell you it can...Test the highs.
We now we have a series of higher highs (2) and higher lows (2), giving traders support for buying into a potential breakout of the Opening Range High (ORH). Of course there are those that may be fading the highs that early in the morning as well (of course there could be scalpers as well, just playing off of the 78.6% retracement and targeting the previous High).
If we're looking to get in on a breakout then we need to have some sort of profit objectives.
- Draw some 3-point Fibonacci Price extensions and look for confluence areas, where price could either turn around or consolidate within. They can also highlight swing lows to trail stops off of.
The two extensions drawn here are both projected off of the same swing low (the most recent one), but one is a measurement taken between the PDC and the Opening High, while the other is the most recent low to high range.
Those 78.6% retracement levels always seem too steep to rally off of, but it often acts as a key pivot.

Monday 11_30

As I mentioned over the weekend, POT and RIMM were both on my radar this morning. Due to technical difficulties I missed the ideal opportunity to short RIMM this morning at overhead resistance.
RIMM currently sits under $58, which looks to have turned Support into Resistance (SbR).

POT rallied this morning up to a previous level of resistance. This impulse move registered a higher momentum high compared to a lower high in price (Slingshot setup/Hidden Divergence).Indicated on the chart below is the entry and exits taken on this trade (down arrow with small horizontal lines). The ellipses on the 3/10 oscillator highlight patterns to look for as entry potential. The first ellipse shows how the fast line falls under the slow line and corrects into it at the highs of the day, leading to a correction off of the trendline on a momentum divergence.
Of course by the time the oscillator registers a confirmed correction the move may already be too far gone. So, I looked to put an order in under the pivot which would confirm a bear flag breakdown (after all, these pullbacks in the 3/10 just highlight flag patterns).Also highlighted on this chart is a bullish Wolfe Wave setup that occurred. Unfortunately, when I put my order in to go long price ran away from me. The buy divergence lent confidence to the entry, while vwap gave some confidence for the target line.

Sunday, November 29, 2009

RIMM ahead

RIMM currently sits on top of a prior gap support level ($58) created back in April. Price tested that gap on Nov. 2nd and reversed strongly. It then tested it again on the 20th of Nov. and couldn't get much of a rally behind it, leading to Friday's gap down.Should RIMM slip into this gap range I'd be looking for potential support at around $56.5 (78.6% retracement and 61.8% Fib extension), followed by the $54 area (previous lows & 100% Fib extension).Should we bounce from here, look for possible resistance come into play at an overhead trendline ($59-$60).
A bounce, we look for short opportunities either at the PDH's, the 50EMA, or overhead trendlines (depending on how strong the bounce is).
If price can't get beyond the 20EMA and PDH's we look to play a base break of the $58 level.
If we gap down from here we look to sell pullbacks (either in a trend scenario, or a retest of the base).

Saturday, November 28, 2009

POT setups

Something curious to see unfold over the next week will be the direction of POT.
While it seems to have broken down from a Head&Shoulders pattern on the 60-min timeframe, it also looks to have set up a bullish Wolfe Wave.
The Head & Shoulders breakdown gives a rough target of $104 to the downside. While the bullish Wolfe Wave scenario could challenge the $115 range.
Some matters of importance on this chart:
-The Wolfe Wave 1-3 line is also the neckline of the Head & Shoulders pattern (Wolfe Wave's just reflect the nature of price trying to recover from a trendline break)
- The 5-point occurred on a bullish momentum divergence, leading to a Slingshot in price, bringing us to were we are now. The bullish momentum divergence worked at the open on Friday, but momentum could still turn lower. It could of course turn higher, in which case the most recent session could be a bull flag (bringing us to the 1-4 target?). After all, price only retraced 38% of it's range.
- If the measured move does play itself out and we end up at $105, that's still only a 50% retracement in the run up from Nov. 3rd until the most recent highs, putting us right back to the breakout on 11/17, then what?
Based on the shorter time frame I would be leaning on a short bias going into Monday and watching to see how the Previous Day's Lows would be tested (or a test of the 78.6% retracement level from Firday's range).
The momentum push down on Friday was the largest we've seen in some time (on THIS time frame, still yet to be confirmed on the higher time frame), either it's not done correcting from that impulse and will want to test Friday's gap (H&S neckline) some more, OR it is done correcting from that impulse, and ready for another impulse push down (in which case we should look for a short-term buy divergence on the way down).
Here's how I'll look at it:

Monday, November 23, 2009

DXY wolfe

Are you sick of me posting Wolfe Waves yet? haha I can't help myself!
Here's a 60min chart of the U.S. Dollar Index (DXY) that seemed to have set up a bearish Wolfe Wave recently.
Important points to take notice of include;
-the #5-point coincided with a prior level of resistance
-the target line (red) is very extended to the downside. So if you were to have taken this trade setup (or any Wolfe Wave for that matter), rather than look at the target line for an EPA, you should be aware of potentially strong support areas ($75 in this case) that may prevent price from achieving it's target (though this issue still has time to reach that target line).

GS wolfe setup

Here's a trade I took this morning in GS based on the Wolfe Wave setup.The green horizontal line was my entry price. The white arrow was my entry bar. Again, I need to display some patience and enter on a green bar with some range in it.

Take note of support levels going into the #5-point in a bullish Wolfe Wave. Today's example in GS saw the 5-point come into a resistance level from the previous session (also the PDO!). More simply put, the entry was merely a pullback after a momentum impulse that coincided with a Resistance-turned-Support level (similar to the Holy Grail setup).

Friday, November 20, 2009

sector leaders

Of note this past week we had two sectors that stood out making new 52-week highs.
XLP (Consumer Staples ETF) has recovered 38% of it's March lows and closed 11% away from it's Sept. '08 highs.Also there's XLV (Health Care Sector ETF) trying to recover previous support levels.Within XLV there's BMY that broke out of a long-term sideways range and may have some follow-through going forward.

fail

Took a whopping two trades today, both for losses. They were very small and ordinary losses, nothing earth shattering.
The first was a scalp at the open. Being that it was a scalp, it had a very short leash (stop loss). My objective was to get to the $110 range where the previous day's last hour range highs were and the 127% Fib. Retracement (drawn from PDC to today's Open).
I entered right at the 78.6% retracement (price seemed to be flagging bullishly) and pulled the trade as price looked to be setting up a small bear flag on waning TICK.
In hindsight perhaps I should have snapped my Fib. lines between the pre-market highs and lows and entered on the opening base break.
The second trade was a Wolfe Wave setup. I had a buy limit order in at $109 and came within 2-cents of getting filled. I then jumped the gun to get in and, as a result ended up with a lousy fill and got stopped out as price tested the lows. Again, in hindsight, I should have had more patience and my stop should have been below the LOD. Being an Opex Friday one should expect a choppy market and patience would have paid off. I did jump the gun on my entry and should have waited for a 5-min bar to close bullishly before getting in.
Well, at least Opex is over and I'm starting to feel better from the cold I've had all week. Next week should be perhaps a little dull, with the Thanksgiving holiday shortening the week, and then it's December already!! crazy!

Thursday, November 19, 2009

taking it easy

As I recover from a cold I'm feeling slightly less lazy to make a post, so I just wanted to put up the one trade I did take today. I know the adage of "don't trade when you're sick," but when you see a setup like this, you just owe it to yourself to take the trade. I didn't even find this one on my own, a little birdie on my shoulder called it out. Anyway, TSL had a number of things going for it today;
-For one, it was up nicely in an overall down day
-Volume was relatively huge
-It had two momentum pushes to the upside, and looked to be flagging into a probable 3rd
I snapped a 3-point Fibonacci Extension to get an idea for potential upside targets (set my order to get out of half a few cents below the 61.8% extension), while the stop below was kept very tight (a high & tight flag like this should not give up very much footing).
The three horizontal dash lines are my entry fill with an up arrow, and two exit points for a half fill and a stop out. Not a big move, but still a high probability trade setup.

Monday, November 16, 2009

FCX

FCX is testing '09 highs again (3rd week of the last 5). The weekly chart shows some interesting things; for one, the Cup w. handle that formed going back to October '08 and breaking out in July of this year. Also, price now sits at a confluence of resistance in the form of an overhead gap and a 61.8% Fibonnaci retracement level (drawn from '08 highs to '09 lows). The measured move coming out of the cup & handle would put price right up against the 78.6% retracement.While on the daily chart, price formed another Cup w. handle pattern recently, with a measured move very close to the one projected on the weekly.

This morning price gaped above a previous resistance level; an important step in making an attempt at the long-term gap fill.

RIMM

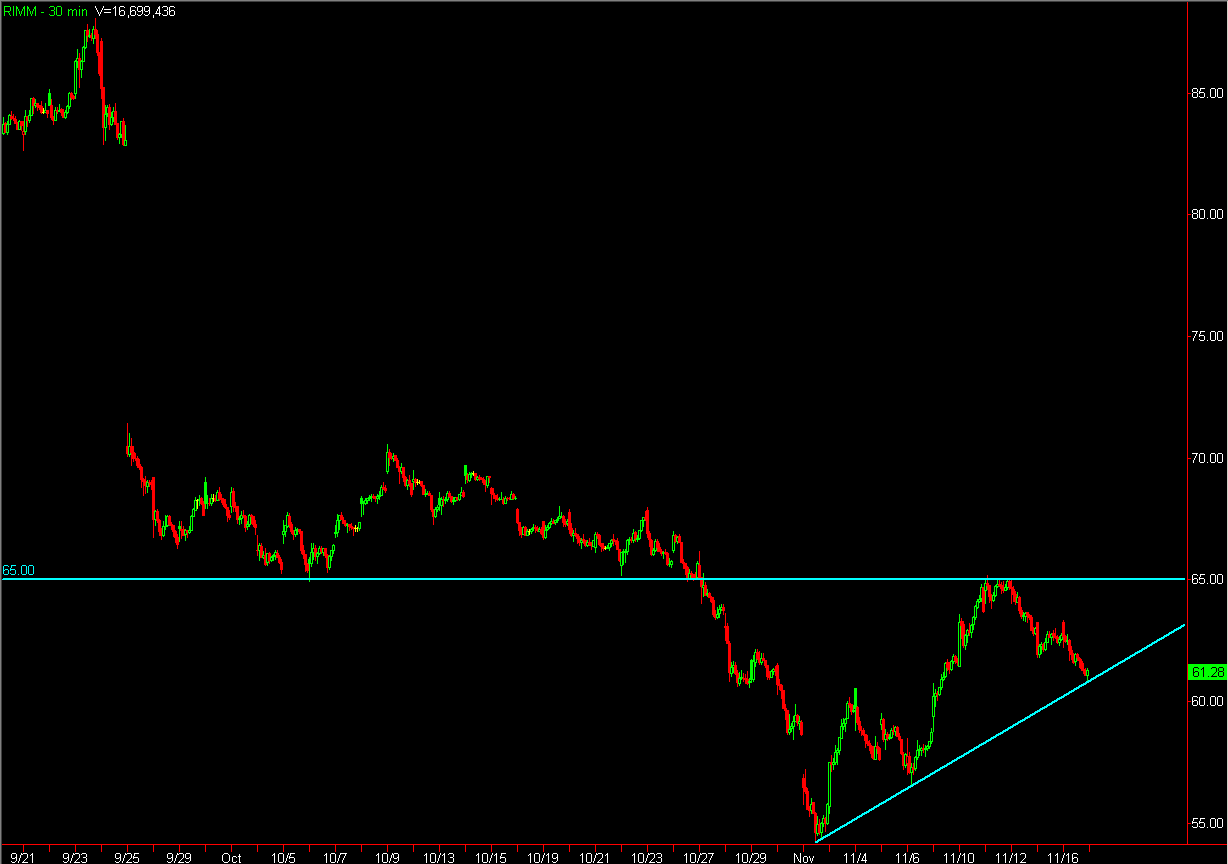
RIMM formed a pivot resistance level at $65 recently and sits at a level which could loan it support from here.It was supported today at a trendline extension which happened to be right on top of a 38% retracement level (drawn coming off of the lows and into the $65 pivot) and of course a momentum divergence.
And to top it all off, it looks as though it could be setting up for a 5th Wave!

Sunday, November 15, 2009

Contrary Wave

Looking at the Dow Jones Equity REIT Index I noticed a Bearish Wolfe Wave that developed throughout much of this year. As it reached point 5 (where one is to enter a short position with a target of the 1-4 line) it began to unfold as expected. However, price found support at the 1-3 line and turned around, morphing into a contrary wave (a bullish Wolfe Wave within this bearish Wolfe Wave). These contrary waves can develop as seen here, or even within two separate time frames intr-day.Fortunately in this example you would have been able to exit with a profit or at break-even. But it is a good example in monitoring the health of these patterns throughout their cycle, especially around the 1-3 line where price can find support (2-4 line resistance in a bullish wave) when making a move to their target line.

Chart for the Week

Looking ahead this week it will be very interesting to watch the Dow Jones Industrial Average and how it will deal with the confluence of overhead resistance.
Similar resistance above for the Dow Transportation and Utilities Index. Curious thing about these two is the Right-Angled and Descending Broadening formations taking shape (a bullish pattern).

Friday, November 13, 2009

300m

The bottoming process on the SPY lasted from roughly October '08 to March '09 with enormous volume. As a "bottom" was put in place volume then tapered off until about April of this year. There was a stretch through the summer where the highest volume reading was somewhere over 300-million shares.
So on the chart below I have the most recent 3 sessions indicated where 300-million+ shares were traded. Only 3 days in the last 125 sessions have had such a reading, two of which in the last 42 sessions. Curious that the last two "surges" saw the market turn around the next day. I have another vertical line marked where, recently, volume registered nearly 300-million shares, and again price turned around the next day. These cycles are getting shorter. Is it a sign of the season, or something more curious?

Friday 11/13

In the last 8 sessions the SPY has gained 6.98% and in the last 3 sessions it retraced no more than 1.87%. Things can go either way, but mostly feels like it's hanging by a thread as it waits for the next surge of buying.
This morning's test of the previous day's low was met with very strong volume:
The chart below has horizontal lines indicating the previous day's Open/High/Low/Close.
Of particular interest are the day's momentum divergences and First Cross entry signals. Also the fact that price was rejected from the PDO after basing around it for an hour.It's also interesting to observe how much price has moved in these last three days. Key in on the 78.6% retracement zone.On the 15-min chart we closed above our bullishly oriented Moving Averages (though if you use Simple Moving Averages price is wedged between the two MA's, so whatever). Price has retraced over 38% from our lows by today's close. Perhaps Monday we'll see a gap or move up to test the $110 price, being that we spent so much time around it today and Wednesday.
The weekly is interesting; showing those momentum divergences since March. March through July gave two divergent impulse pushes following a small window of downside momentum (which only amounted to a 7% correction). From mid-July to the end of this week, we have had two similar (and smaller still) divergent impulse pushes, and while price closed at it's highest price since October '08 it has barely any momentum left in it. Either we get more impulse up or correct another 7%, but something's got to give.

Thursday, November 12, 2009

USO

USO has been fighting to stay above this $39 mark for a while nowWatch for another bounce or potential failure.